TBW - Briefing - The state of the crypto market in Q3 2025

The third quarter continued the rebound seen at the end of the second quarter, marked first by the US tariff tantrum and then by the market rally following the announcement of a 90-day trade truce. Against this backdrop, risky assets performed exceptionally well: Bitcoin and Ethereum hit new all-time highs, while flows into ETFs soared across the market.
On the macroeconomic front, the period was favourable for digital assets and equities. The US Federal Reserve embarked on a cycle of monetary easing confirmed by a rate cut in September, offering an additional tailwind. Despite this buoyant backdrop, investors remain cautious about the global economic outlook.
Bitcoin and Ethereum ended the quarter at their all-time highs, joined by another indicator of caution: gold, also at an all-time high, a symbol of the persistent mistrust of part of the market.
Several announcements marked the period: the opening up of 401(k) retirement plans to digital assets, the launch of blockchains by Stripe and Circle, and SWIFT's choice of Linea for its on-chain operations. Meanwhile, Solana is rolling out Alpenglow, Hyperliquid is competing with Aster, and the first staking ETFs are on the horizon.
Important news
US passes GENIUS Act, first federal stablecoin framework
Passed on 17 July 2025 (308 votes to 122) and signed the very next day by Donald Trump, the Guiding and Establishing National Innovation for US Stablecoins Act (GENIUS Act) establishes the first federal regulation of payment stablecoins in the United States. The text provides a framework for their issuance, supervision and reserves. The law introduces a dual licensing regime (federal or state) for "permitted payment stablecoin issuers", imposes a 1:1 match in liquid assets (cash, T-Bills) and prohibits any promise of return. Authorised issuers will have to publish certified monthly reports, comply with BSA/AML rules and keep their reserves in segregated accounts. The law removes stablecoins from the securities category, gives holders priority in the event of bankruptcy and creates a Stablecoin Certification Review Committee to harmonise the regimes. It is due to come into force by January 2027. Washington is already preparing a second bill, the Clarity Act, to complete the overall framework for digital assets
US pensions open to cryptos and private equity
On 7 August, Donald Trump signed an executive order allowing 401k retirement funds to invest in cryptos, private equity and real estate. This major reform affects nearly 70 million Americans and $12 trillion in assets. Previously limited to stocks and bonds, these plans will now be able to access new asset classes. BlackRock, already very active on the subject, is hailing a reform "that will enable millions of Americans to strengthen their portfolios", according to its head of retirement, Jaime Magyera. For the crypto sector, this opening marks a historic step towards long-term integration into American savings - even if some fear a rise in litigation linked to the volatility of these investments.
Bitcoin hits a record $124,000
On 14 August 2025, bitcoin broke through $124,000 for the first time, buoyed by Donald Trump's pro-crypto policies, the Fed's anticipated monetary easing and the gradual closure of SEC court cases.
The Fed begins a cycle of rate cuts
Under political pressure, the Federal Reserve cut its key rate by 0.25 points on 17 September, to a range of 4% to 4.25%, its lowest level for three years. Jerome Powell justified this decision by citing the economic slowdown and rising unemployment, while keeping a close eye on inflation (2.9% in September). Two further cuts are expected between now and the end of 2025. Only Stephen Miran, who is close to the White House, has argued for a deeper cut of 0.5 percentage points, illustrating the growing tensions between the Fed and the executive branch as Powell's term draws to a close in May 2026.
Gold breaks all-time record at $3,870 an ounce
On 30 September, the yellow metal hit a new high, buoyed by falling rates, geopolitical uncertainties and growing mistrust of the major currencies. Gold remains a favoured refuge from market volatility - a tangible counterpoint to the rise of digital assets such as bitcoin and stablecoins.
The state of Bitcoin
The third quarter began with a sharp correction: on the first day of trading in July, Bitcoin fell to $105,000 before rebounding quickly, supported by continued strong flows into ETFs and the signing of the GENIUS Act, seen as a favourable political signal for the industry. On 13 July, the cryptocurrency hit a cycle high of $123,000 intraday, before stabilising between $117,000 and $120,000 until the end of the month. On 13 August, it set a new all-time high of $123,355, peaking at $124,535 the following day, before undergoing a correction of more than 12%, bringing the price down to around $108,000.
Beneath this apparent volatility, two major dynamics emerged: a rotation towards altcoins and massive profit-taking by long-term investors.
The latter made around 815,000 BTC in profits over the quarter, representing $93.3 billion in selling pressure. More than half of these sales took place in July, explaining the price's stagnation in a narrow range and the speed of the post-record correction.
The redistribution was mainly to short-term holders, who accumulated an additional 510,000 BTC, while long-term investment portfolios saw their net balance fall by 490,000 BTC. Direct accumulation funds (Digital Assets Treasury) continued to outperform ETFs, adding 190,000 BTC compared with only 55,000 BTC purchased by ETFs. This shift illustrates a gradual transfer of supply from patient hands to more opportunistic players.
.png)
A second bout of selling occurred after the Federal Reserve's September meeting, when many traders opened leveraged positions in the hope of a post-rate cut rally. On 22 September, the market experienced one of the largest liquidation episodes of the quarter: $3.6 billion of assets were liquidated, of which only $897 million (or 25%) came from Bitcoin positions, corresponding to additional selling pressure of around 7,800 BTC.
.png)
On the mining side, the period was generally favourable. The revenue/production cost ratio remained between 1.35 and 1.45, indicating that miners were generating up to 45% gross margin on their activity. This profitability has reduced selling pressure from the sector and kept any risk of miner capitulation at bay for the time being.
The best-performing financial assets
The third quarter of 2025 offered an unusual hierarchy between the main risky assets. Despite a new all-time high in August, Bitcoin posted a modest performance, well below its dynamism of the previous quarter. After a gain of 38.46% in Q2, the increase was limited to 7.93% in Q3, a performance five times lower.
This slowdown was primarily due to weaker ETF flows, particularly in July and August, with only $3.4 billion in net inflows in July and $0.6 billion in outflows in August, compared with $12.7 billion in net inflows in Q2. In addition, rotation into altcoins and profit-taking by long-term investors limited upside potential.
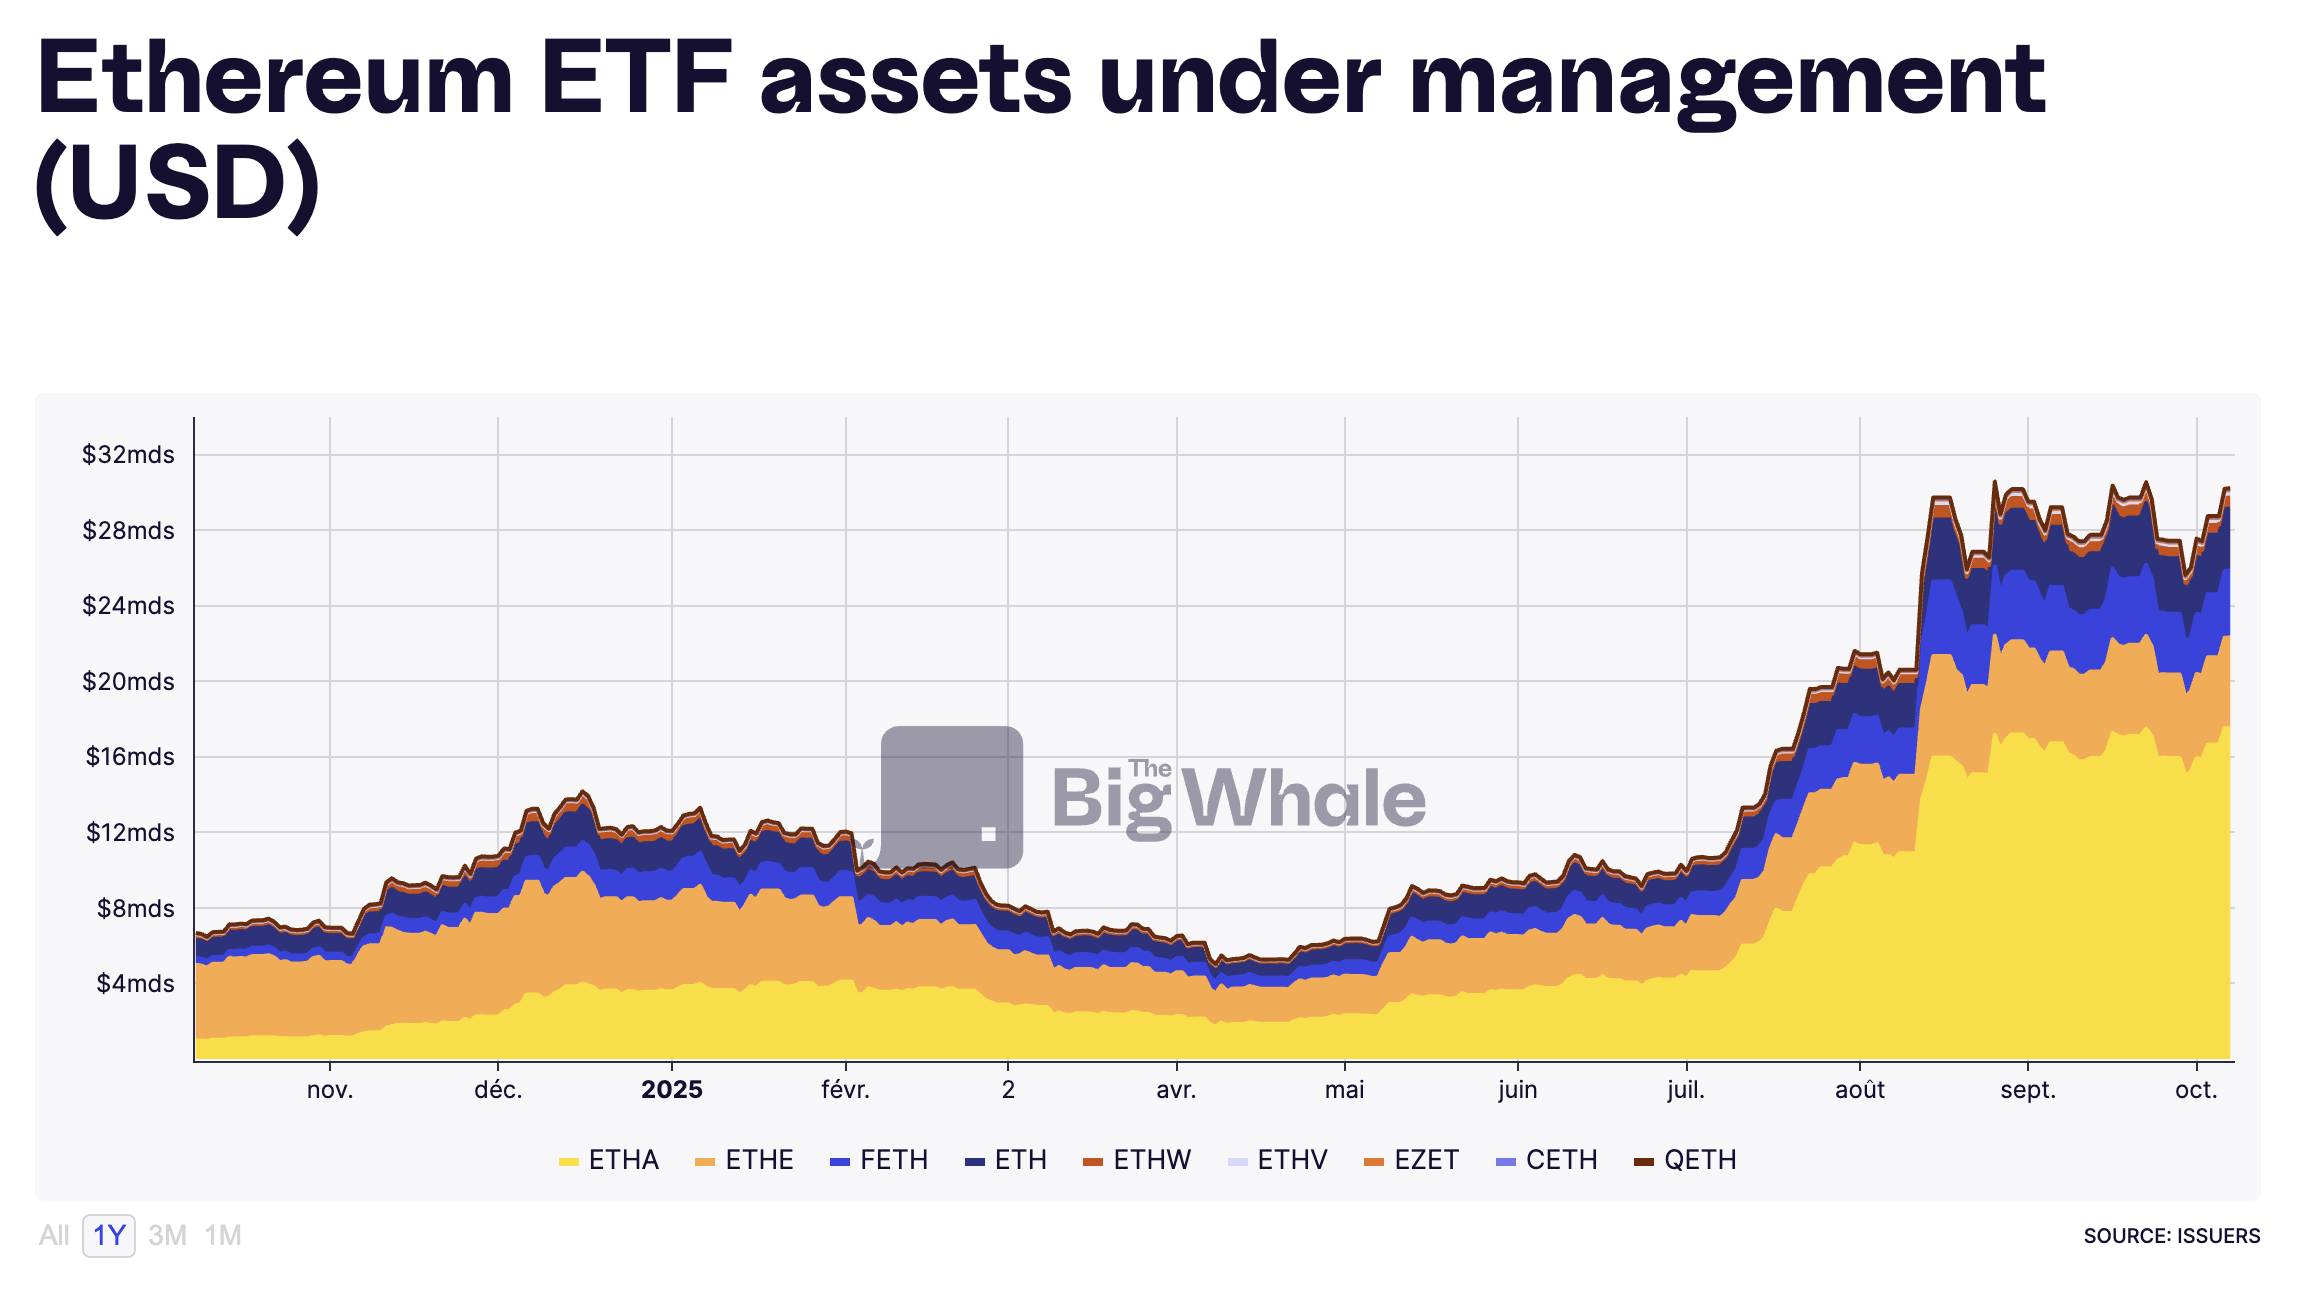
In contrast, Ethereum had one of its best quarters on record. The ether price jumped 72.06%, after already rising 58.17% in the previous quarter (excluding staking returns).
This spectacular movement is directly linked to the massive influx of capital into Ethereum ETFs, which recorded $5.43 billion in net inflows in July and $3.87 billion in August.
Although the pace slowed in September (260 million), the total of $9.3 billion over the first two months of the quarter boosted assets under management from $10 billion to $26 billion, an increase of 150%, propelling the token to a new all-time high.
The rest of the cryptocurrency market also rose, though without matching Ethereum. The TOTAL3 index, which measures the performance of all altcoins (excluding BTC, ETH and stablecoins), gained 37.81%, compared with 24.07% in the previous quarter. The Alt Season Index, which rose above 50, confirms the return of a cycle of outperformance by alternative assets.
The surprise of the quarter, however, came from gold, whose performance outperformed both equities, Bitcoin and even some technology assets. The yellow metal gained 16.77% in Q3, taking its annual gain to 45.46%. This surge, unexpected against a backdrop of monetary easing, was driven by massive purchases by central banks, which acquired a net balance of 10 tonnes in July alone to offset the depreciating effect of low interest rate policies. Combined with sustained demand from cautious investors looking for a store of value, this momentum took the price of gold to an all-time high of $3,858 an ounce.
On the equity markets, US technology stocks dominated the period. Tesla led the way with a gain of 45.56%, ahead of Google (+36.59%), Palantir (+39.99%), Oracle (+25.67%), Broadcom (+23.52%) and Nvidia (+19.07%). These performances lifted the S&P 500 and the Nasdaq to new all-time highs of 6,693.46 and 24,761 points respectively. In Europe, ASML led the rise in the Euronext 100, up 7.38% over the quarter.
Finally, the bond market accompanied this uptrend, with expectations of rate cuts causing the yield on 10-year Treasuries to fall by 2.05%. Long rates nevertheless remain higher than short and intermediate maturities, as the markets have not yet priced in the risk of a short-term recession.
.png)
The state of Layer 1 blockchains
The third quarter was particularly favourable for Layer 1 (L1) blockchains, boosted by significant capital flows and a rotation away from Bitcoin. This movement set in motion a veritable "altcoin season", marked by a strong recovery by the main competing networks.
Price performance: Ethereum leader
.png)
Ethereum was the star performer of the quarter, rising 72.06% to consolidate its position as the undisputed leader among altcoins. Behind it, Avalanche posted a remarkable performance of 64.24%, while BNB, Solana and Cardano were all up between 40% and 50%. After an exceptional second quarter (+287%), Hype slowed significantly (+18.12%), weakened by the rise of Aster (backed by Binance) on the perpetual derivatives market.
Near made a remarkable return to the top 10 altcoins, buoyed by a sustained increase in its weekly active users (+28.48% over the quarter). Conversely, Toncoin (TON) continued to lag behind, posting an underperformance of -4.05%, while Tron and Sui were content with increases of less than 20%.
Users: Solana in the lead
In terms of adoption, Solana dominated the first half of the quarter, surpassing the 50 million weekly active users threshold. But in the last few weeks, the trend has reversed: Binance Smart Chain (BSC) and Near have taken over, maintaining a more stable user base of between 40 and 60 million weekly active addresses.
On the other hand, Cardano remains one of the Group's least-used networks, despite an honourable price performance. This discrepancy between market capitalisation and actual activity highlights a phenomenon already observed in previous cycles: L1 growth now depends as much on actual adoption as on the ability to attract capital, and investors seem to favour the most dynamic ecosystems over the oldest.
Developers: Ethereum remains the benchmark
.png)
On the development front, Ethereum maintains a clear lead over its competitors. The network counted an average of nearly 200 active developers each week in the third quarter, confirming its role as the main innovation hub among Layer 1 blockchains.
Cardano climbed into second place, buoyed by sustained activity in research and development, while Hyperliquid, despite a very limited number of active contributors, managed to maintain remarkable performance. This contrast illustrates the rise of agile channels capable of rapid growth without a large pool of developers.
Transactions: Hyperliquid crushes the competition
.png)
On the on-chain front, the dominance is clear: Hyperliquid is by far the most widely used channel in terms of transaction volume. It processed more than 2 billion transactions per week on average, with a record peak of 7.3 billion over the period.
>> HyperEVM: a network under construction backed by an on-chain trading giant
Solana comes in second, confirming its strength in terms of throughput and user activity, while the other networks appear almost invisible on the comparative chart.
Revenue from fees: Tron still in the lead
As far as revenue from transaction fees is concerned, Tron retains top spot, averaging around $50 million per week, despite high volatility. Hyperliquid ranks second, reinforcing its profile as a heavy-use blockchain, both in terms of volume and monetisation.
>> Tron: A stablecoin infrastructure under stress
Only three other blockchains exceed the $1 million threshold in weekly fees: Solana, Ethereum and Binance Smart Chain. All the others remain well below. This imbalance shows that, despite the proliferation of L1s, the creation of economic value remains concentrated on a small number of networks capable of combining technical performance and real activity.
Inflation and monetary dynamics of L1s
Inflationary pressure remained generally low on all Layer 1 blockchains in the third quarter, with rates hovering around or below 2%. This stability reflects better control of money creation in most ecosystems, often linked to burn mechanisms or a reduction in scheduled issuance.
Near had a contrasting quarter: a significant increase in supply in circulation at the very beginning of the period, followed by two successive deflationary phases, reflecting a rapid normalisation of issuance dynamics. Cardano, for its part, carried out two significant destructions of tokens, each representing 2% of supply, reinforcing the deflationary trend of its token.
For the majority of other chains (Ethereum, Solana, Avalanche, Sui or Binance Smart Chain) inflation remained contained within a narrow range of -1% to +1%, a sign of a balance between token issuance and destruction.
The big winner of the quarter, however, remains Hyperliquid, which posted constant deflation of 0.16% thanks to its integrated burn mechanism. This model, combined with record transactional activity, consolidates the chain's reputation as one of the most economically efficient at the moment.
Total Locked Value (TVL)
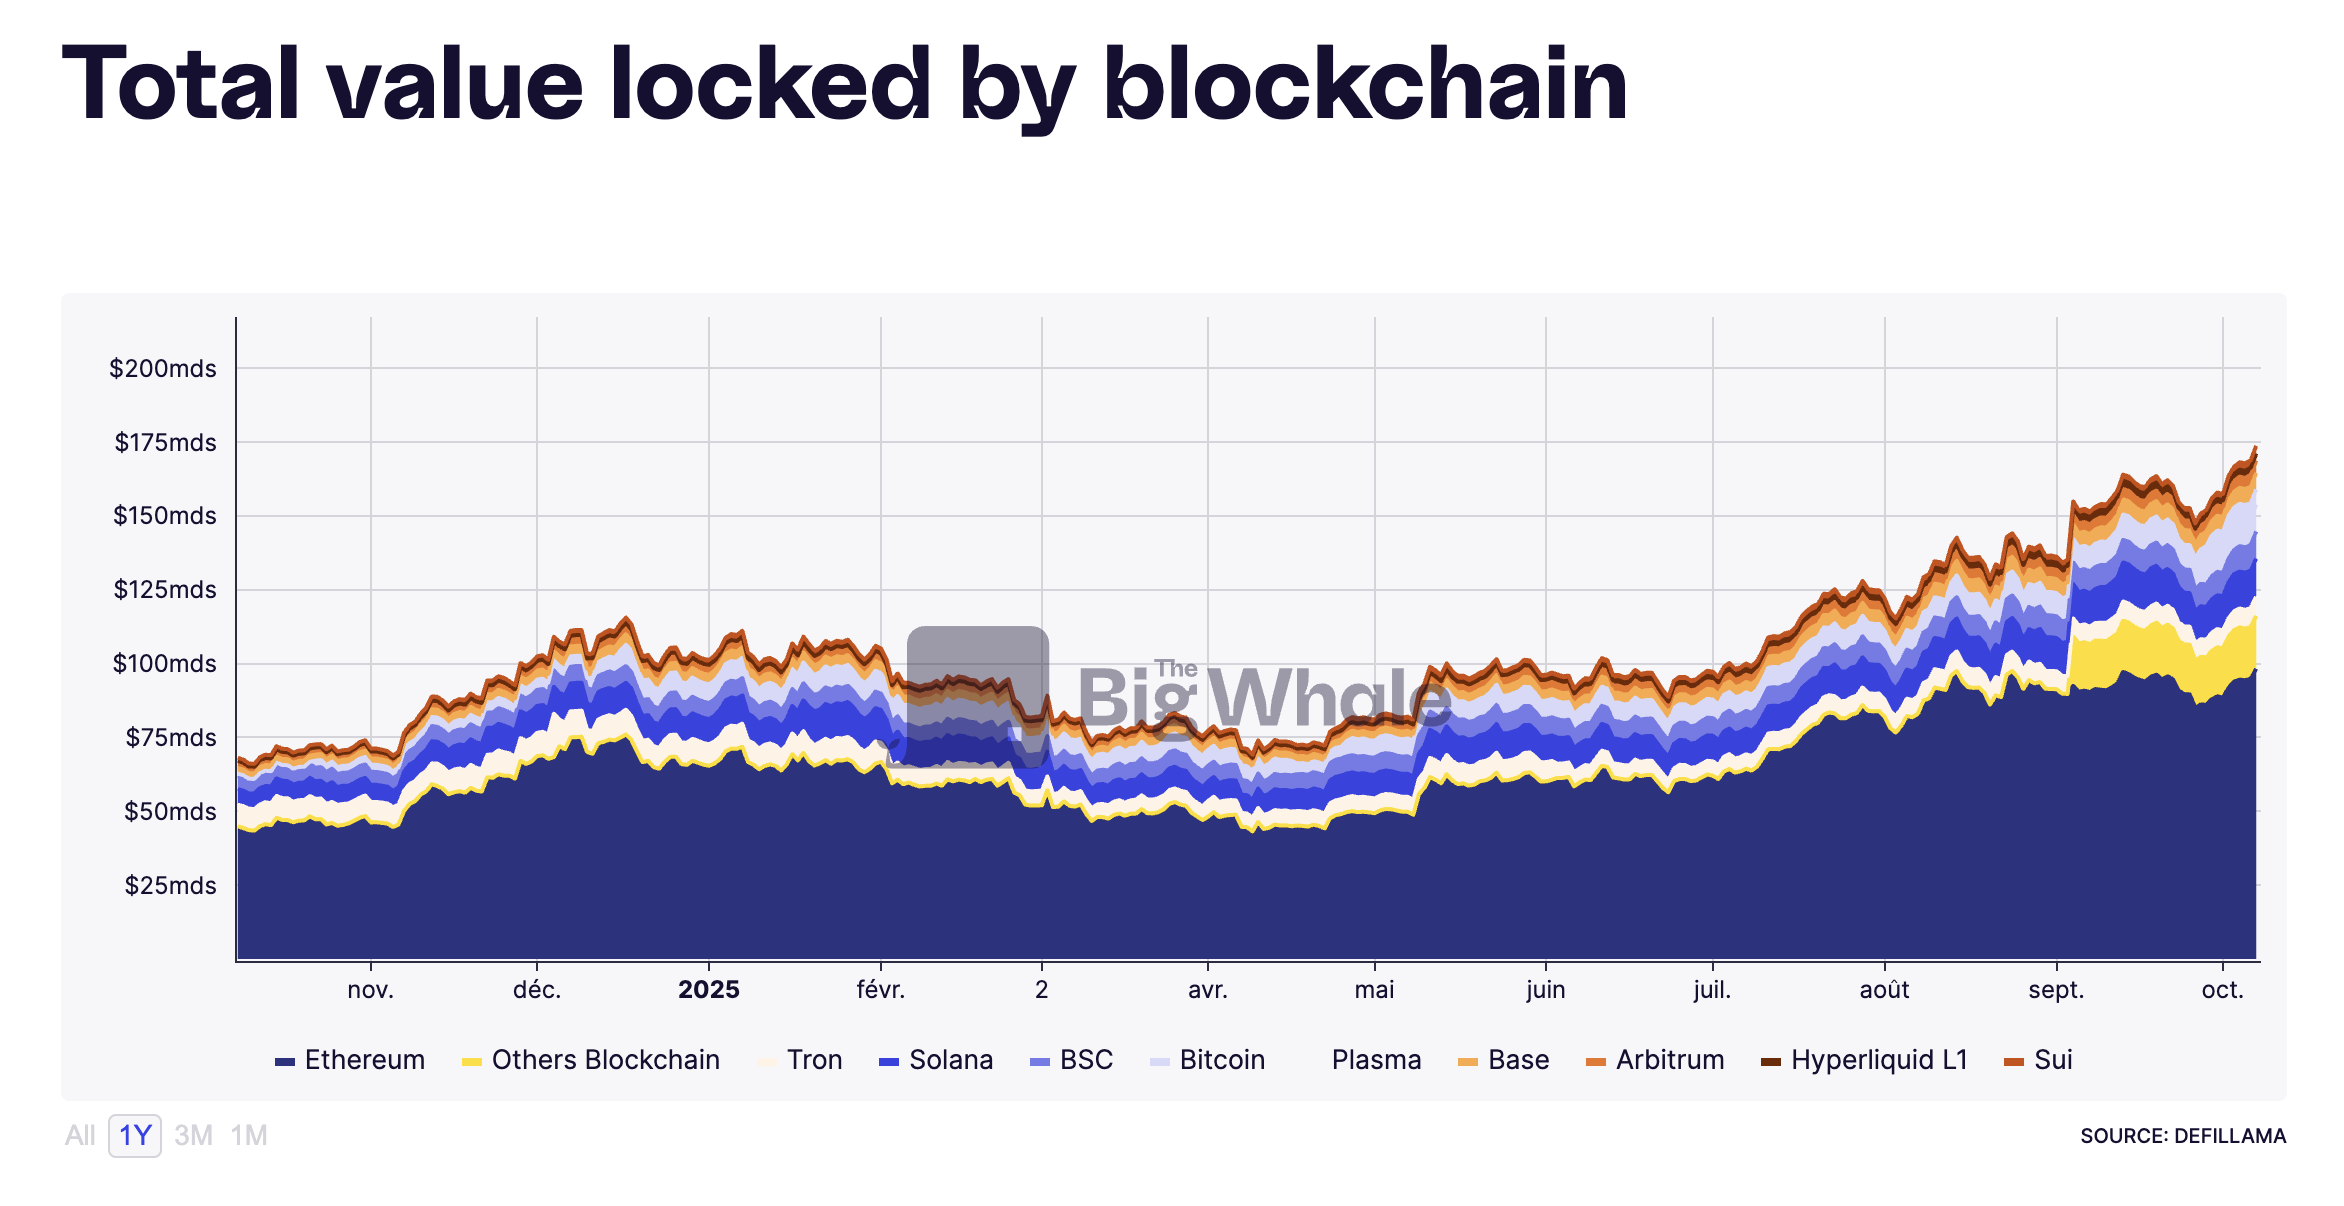
The Layer 1 blockchain sector has seen a strong expansion in its TVL, which grew by $68 billion in the third quarter, an increase of more than 68%. This growth can be explained both by the revaluation of altcoins (a direct consequence of the renewed appetite for risk) and by the increased supply of stablecoins deployed on the main networks.
Ethereum remains the undisputed pillar of this ecosystem, concentrating 56% of the market's total TVL. Despite the rise of new blockchains such as Solana, Avalanche and Hyperliquid, none has yet managed to significantly erode this dominance. The quarter thus confirms that Ethereum remains the main infrastructure for on-chain finance, both for DeFi applications and for the tokenisation of real assets.
GDP of L1 blockchains
.png)
The economic activity of the main layer 1 blockchains accelerated sharply in the third quarter. The industry as a whole saw a broad-based increase in on-chain economic output, reflecting an intensification of exchanges and value creation within ecosystems.
Ethereum generated an additional $50 million in output compared to the previous quarter, with an average weekly growth rate of 6.42%. It remains the most productive blockchain in the sector in absolute terms. However, the biggest increase came from Binance Smart Chain, whose activity jumped 28.31% over the period, driven by strong use in DeFi and low-cost transactions.
Solana, despite being valued lower than Binance in terms of fully diluted capitalisation, produced on average more than double the economic activity over the quarter, confirming its strength in terms of actual usage.
Among the other chains, Avalanche stood out with growth of 18.02%, while Tron and Toncoin posted sustained rates of 9.08% and 8.96% respectively. Solana, meanwhile, recorded average growth of 7.10%.
Globally, the quarter confirms the strength of the on-chain economy: the most widely used L1s are no longer simply attracting capital, they are now generating measurable economic activity, comparable to that of companies or financial ecosystems in their own right.
Capital flows
.png)
Capital flows into the main Layer 1 blockchains reached their highest level of the year in the third quarter, confirming investors' renewed appetite for digital assets.
Ethereum dominates this momentum by a wide margin, with $9.27 billion in net inflows, more than six times the combined total of all other major blockchains. This inflow reflects the confidence of institutional investors, fuelled by the success of ETFs and the rise of on-chain finance.
Behind it, Solana continues to consolidate its return to prominence, with $1.5 billion in inflows over the quarter. Sui and Cardano (ADA) bring up the rear with more modest ($30.9m and $17.4m respectively) but positive flows, reflecting continued interest in secondary projects.
This concentration of flows around a few leading networks highlights a structural trend in the market: the polarisation effect of capital, where investors favour ecosystems with real usage, a solid infrastructure and greater regulatory visibility.
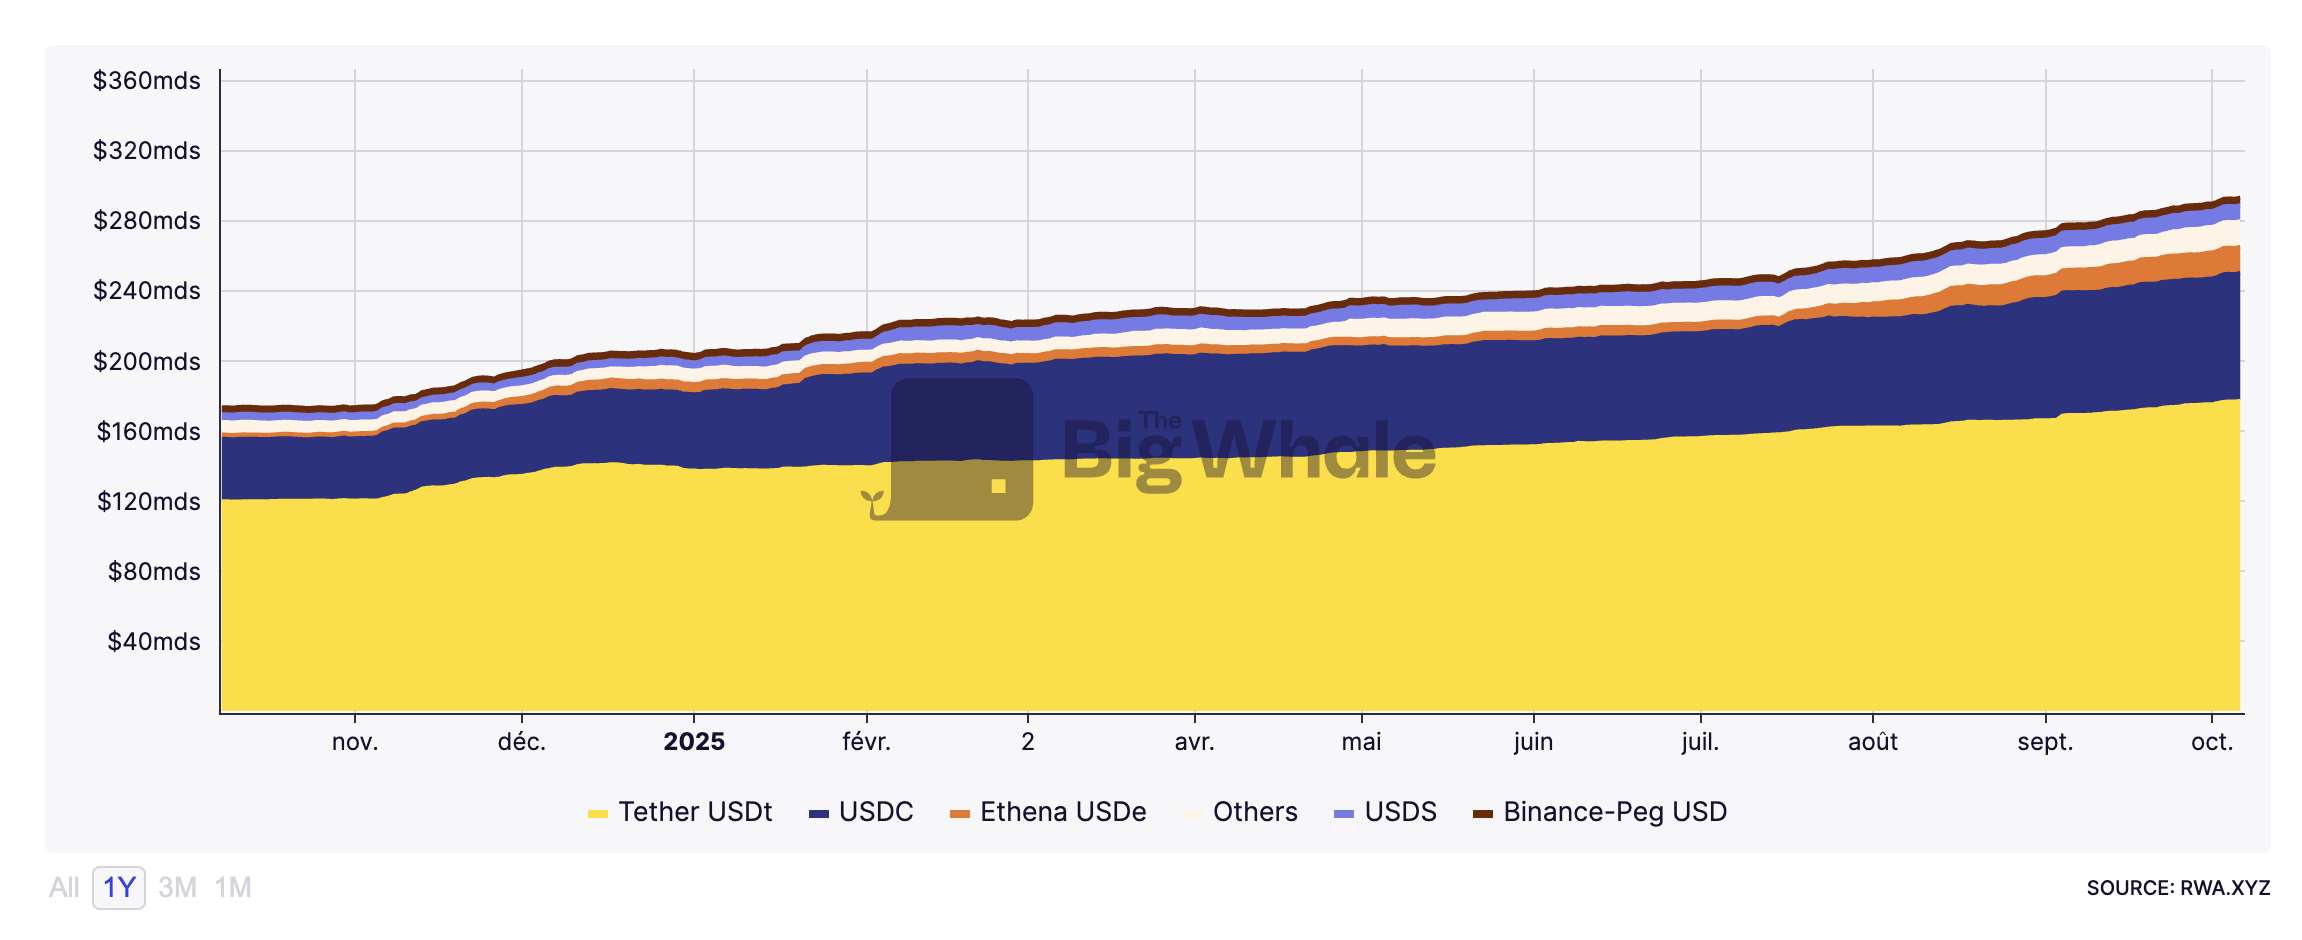
Stablecoin offering
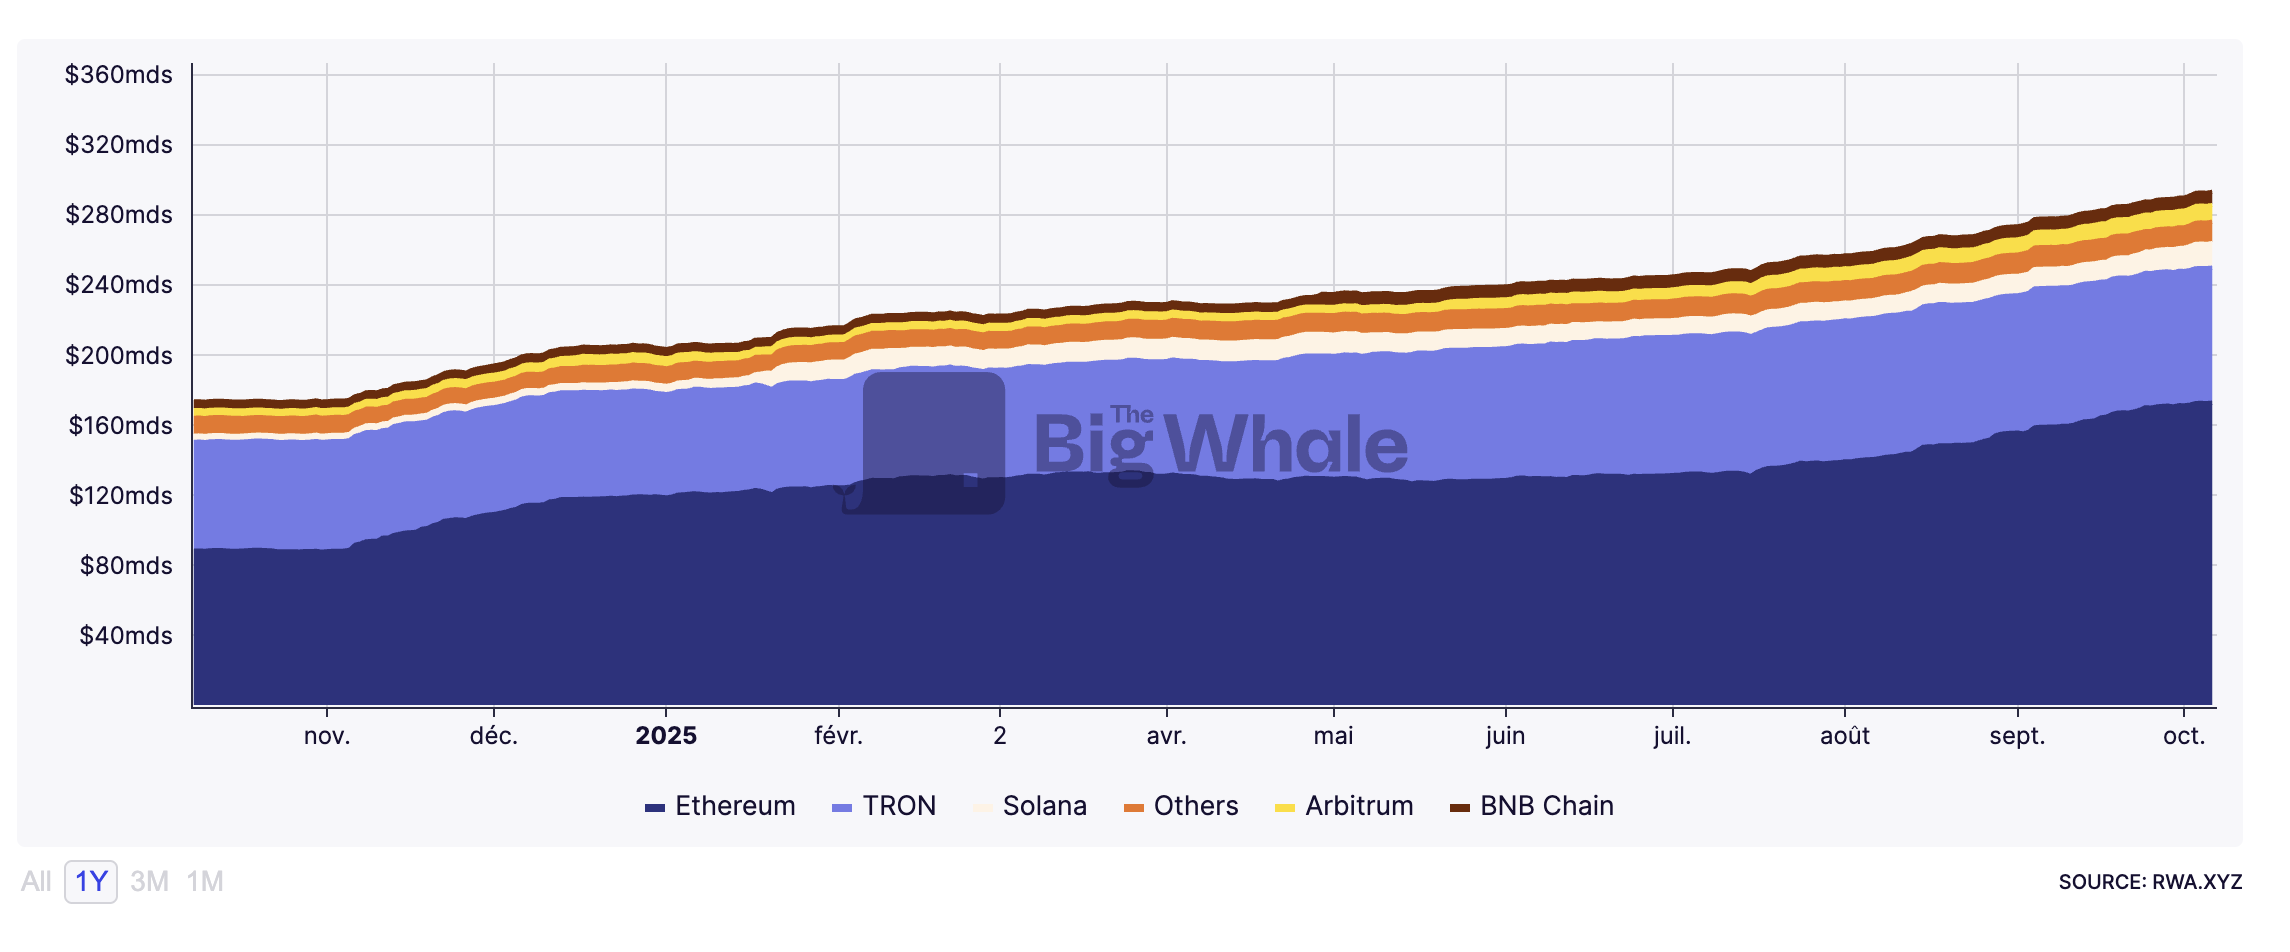
The supply of stablecoins rose sharply in the third quarter, a direct reflection of the return of liquidity to the crypto markets. The vast majority of this expansion occurred on Ethereum, where $40.68 billion of new stablecoins were issued over the period.
This growth confirms Ethereum's position as the central infrastructure for digital finance, where the bulk of USDC, USDT and DAI used in DeFi and institutional payments are exchanged.
Solana is also continuing to grow, with a $4 billion increase in stablecoin supply, driven by strong on-chain activity and the integration of new issuers. Binance Smart Chain, meanwhile, recorded an increase of $1.5 billion, while Tron, historically one of the leading chains for USDT, saw its offering decline during the quarter.
This development illustrates a gradual shift in liquidity towards the Ethereum and Solana ecosystems, to the detriment of Tron, whose model centred on low-cost transfers seems to be reaching a ceiling in the face of the rise of solutions more integrated with institutional finance.
>> Discover our dashboard dedicated to stablecoins
Valuation of the main L1 blockchains
Analysis of the relative valuation of L1s in the third quarter reveals considerable gaps between the most widely used networks and those whose valuations seem disconnected from business fundamentals.
FDMC per weekly active user
.png)
Relating fully diluted capitalisation (FDMC) to the number of weekly active users, Near emerges as the most undervalued blockchain of the quarter, averaging just $67 per active user. The sector average is $182,000, which places Near, along with Avalanche and Solana, among the networks that are still attractive according to this ratio. Conversely, Cardano remains the most overvalued, with a valuation of $1.375 million per weekly user, well above industry standards.
FDMC per transaction
.png)
In relation to the number of transactions carried out, Hyperliquid stands out as the most undervalued chain, with a valuation of just $0.19 per transaction. This exceptionally low level reflects a very high intensity of use, in line with its record volume of on-chain activity. In contrast, Cardano remains the most expensive asset according to this ratio, while Ethereum also appears overvalued in relation to its number of actual transactions.
Price-to-revenue (P/F)
.png)
The ratio of diluted capitalisation to fee income confirms the same trend. Tron stands out with a ratio of 8.13, the lowest in the sector, making it one of the most economically efficient networks. Hyperliquid follows at a distance, with a ratio of 36, reflecting a good balance between valuing and monetising the business.
At the other end of the spectrum, Cardano appears extremely overvalued, with a ratio in excess of 10,000 times its revenues, five times the sector average. These discrepancies confirm that, despite a degree of homogenisation in the performance of L1s, the valuation of a number of projects remains linked more to speculation than to the economic reality of their use.
The state of the stablecoin market
The third quarter of 2025 will be remembered as a pivotal period for stablecoins, both in regulatory and economic terms. Never before have these assets benefited from such an alignment between innovation, institutional adoption and legislative recognition.
The major event of the quarter was the enactment of the GENIUS Act on 18 July, which establishes a comprehensive legal framework for payment stablecoins in the US for the first time. The legislation requires issuers to hold reserves in US Treasury bills, to guarantee transparent information on liquidity and convertibility, and to comply with anti-money laundering and anti-terrorist financing rules. This law paves the way for large-scale integration of stablecoins into traditional payment networks, particularly via e-commerce and fintech players.
The quarter was also marked by a series of structuring announcements: Circle and Stripe unveiled the launch of their own blockchains (Arc and Tempo), designed for instant payments and interoperability between digital currencies.
In Europe, nine banks joined forces to create a MiCA-compliant euro stablecoin, illustrating a desire to reduce dependence on the dollar in on-chain payments. At the same time, Tether launched USAT, a stablecoin backed and regulated in dollars, while Hyperliquid introduced USDH, backed by liquid financial instruments and issued directly on its native blockchain.
The big winners of the quarter
At the end of the third quarter, Ethereum emerged as the big winner across all categories. The network dominated most performance indicators - from profitability and TVL growth to capital flows and stablecoin issuance. Its leadership position was strengthened not only in DeFi, but also in institutional uses, confirming its central role in the global on-chain economy.
Hyperliquid also had a remarkable quarter, establishing itself as the most active blockchain in terms of transaction volume and the most disciplined in monetary terms thanks to its burn mechanism, which gives it a slightly deflationary dynamic. It also emerged as the most undervalued blockchain in terms of the ratio of fully diluted capitalisation to transaction volume.
Tron retained its supremacy in terms of revenue, confirming the stability of its business model based on transaction fees. Near, meanwhile, stands out in the valuation per active user category, displaying the strongest relative attractiveness in the sector. Finally, Solana remains the most-used blockchain in terms of the number of weekly users, demonstrating a particularly high level of community and application activity.
.png)
The Big Whale's view
The third quarter was particularly kind to altcoin holders, who outperformed Bitcoin across the board. On average, altcoins gained five times more than BTC, and Ethereum almost ten times more in percentage terms. This shift in investor appetite resulted in massive flows into Ethereum and then Solana, supported by the announcement of future staking ETFs and the Federal Reserve's rate cut, two catalysts that pushed capital towards the riskiest - and highest-yielding - assets in the ecosystem.
But the euphoria was short-lived. The end of the quarter was marked by massive liquidations, a direct consequence of excessively leveraged positions and market movements orchestrated by certain market makers. This brutal return to reality is a reminder that, despite the growing maturity of the sector, volatility remains a structural component of the asset class.
On the macroeconomic front, the global situation remains fragile. The Fed's rate cuts look more like emergency measures than confident support for growth. If inflation were to pick up again and the central bank were to interrupt its easing cycle, risky assets (cryptos included) could pay the price as early as the fourth quarter.
Finally, gold has taken its revenge: it has outperformed both Bitcoin and equities, regaining its role as a safe haven amid growing uncertainty. It remains to be seen whether this trend will continue until the end of the year.
One thing is certain: digital assets are confirming their foothold in global portfolios quarter after quarter. Their institutional adoption is growing, demand remains high, and their role in global finance continues to grow - whether this is a sustained bull run or a transitional phase before a new macro equilibrium.