TBW - Is Bitcoin's four-year cycle dead?

Key points
- Many factors (institutional adoption, the macroeconomic environment and an extremely concentrated market) distinguish this cycle from previous ones.
- Bitcoin's performance is highly correlated with the growth in cumulative flows to ETFs
- Quantitative tightening (QT), rising unemployment and weak economic activity explain the lack of a euphoric top
- By analogy with the 2019 rally, BTC could bottom one to three months after the announcement of a quantitative easing (QE) programme, before resuming the rise ten to twelve months later.
The traditional concept of the bitcoin cycle
Traditionally, the evolution of the bitcoin price is analysed through a recurring cycle linked to the very functioning of its protocol: halving. Approximately every four years, the reward paid to miners is halved, which mechanically slows the creation of new bitcoins.
In the classic reading of the markets, each halving marks the starting point of a new market sequence. This reduction in supply is generally associated, with a time lag, with a marked rise in the price of bitcoin.
A "typical" cycle thus begins with a halving, followed by a phase of strong price growth that most often extends over six to eighteen months. This phase is then interrupted by a bear market, before a period of stabilisation or recovery, and then the arrival of the next halving, which opens a new cycle.
Historically, cycle peaks have been observed at the end of the year (November or December) following that of the halving, as in 2013, 2017 and 2021. In practice, these peaks generally occur between twelve and eighteen months after the event. Entry into a bearish phase is often identified when the price falls sustainably below its 50-week moving average, a benchmark widely used by investors.
In previous cycles, this breakout occurred around six to seven months after the peak. In contrast, during the 2020-2024 cycle, bitcoin broke back below this threshold very quickly, as early as December 2021 and January 2022, just one to two months after its peak. The same rapid momentum is evident today. If the October peak does indeed mark the high point of the current cycle and if the four-year pattern remains valid, the pullback observed a month later would correspond to the start of a bearish phase, earlier than in past cycles.
Why is this cycle different?
This cycle has been marked by several unprecedented events since its launch. The most structuring elements compared with previous cycles are the introduction of ETFs, a start to the cycle under quantitative tightening, significantly higher interest rates, the absence of a euphoric peak and a market dominated by the theme of artificial intelligence.
ETFs
It all began in January 2024, with the launch of spot bitcoin ETFs in the United States, three months before the last halving. This was a pivotal event, whose impact extended far beyond the bitcoin market alone. Since then, the dynamic of flows into these ETFs has established itself as one of the main determinants of BTC's performance.
The figures are unequivocal. Since January 2024, the monthly change in cumulative flows to US ETFs has explained around 25% of bitcoin's monthly returns. But this relationship strengthens markedly from September 2024: over this period, the correlation climbs to around 80%.
Focusing solely on the current year, cumulative flows explain almost 64% of BTC's monthly performance. In other words, without a sustained acceleration in net inflows, the price is struggling to register an uptrend.
.png)
.png)
The summer stall is a perfect illustration of this dependency. In June, monthly growth in cumulative flows slowed sharply, from 15.24% in mid-June to just 3.61% in mid-July. The immediate result was a marked performance gap, with bitcoin going from a gain of +11% to almost zero, then negative (-1%) between mid-July and mid-August, a differential of almost 12 points.
This sluggish momentum did not pick up thereafter. Flows remained persistently below the 10% growth threshold throughout the second half of the year and until the fourth quarter of 2025, weighing heavily on the asset's performance.
More than just another indicator, ETFs have established themselves as the central barometer of the cycle: as long as the flow machine does not restart, bitcoin remains deprived of its main engine.
The start of the cycle under quantitative tightening (QT)
The 2024-2028 cycle is the first to open against a backdrop of accelerated reduction in the Federal Reserve's balance sheet, otherwise known as quantitative tightening (QT). Despite this, bitcoin peaked at $126,000 in October. QT refers to the action of central banks to reduce the size of their balance sheets by exchanging bonds and refinancing operations for cash, thereby removing liquidity from the financial system.
The current cycle is starting against a backdrop of marked QT by the Fed, the Bank of Japan and the European Central Bank. At this stage, the Fed has reduced its balance sheet by 11.66% since the start of the cycle, following a 17% contraction in 2022, one of the triggers for the previous bear market. Although the Fed remains the main driver of global liquidity, the ECB and BOJ have also tightened monetary policy, with cuts of 6.69% and 8.34% respectively.
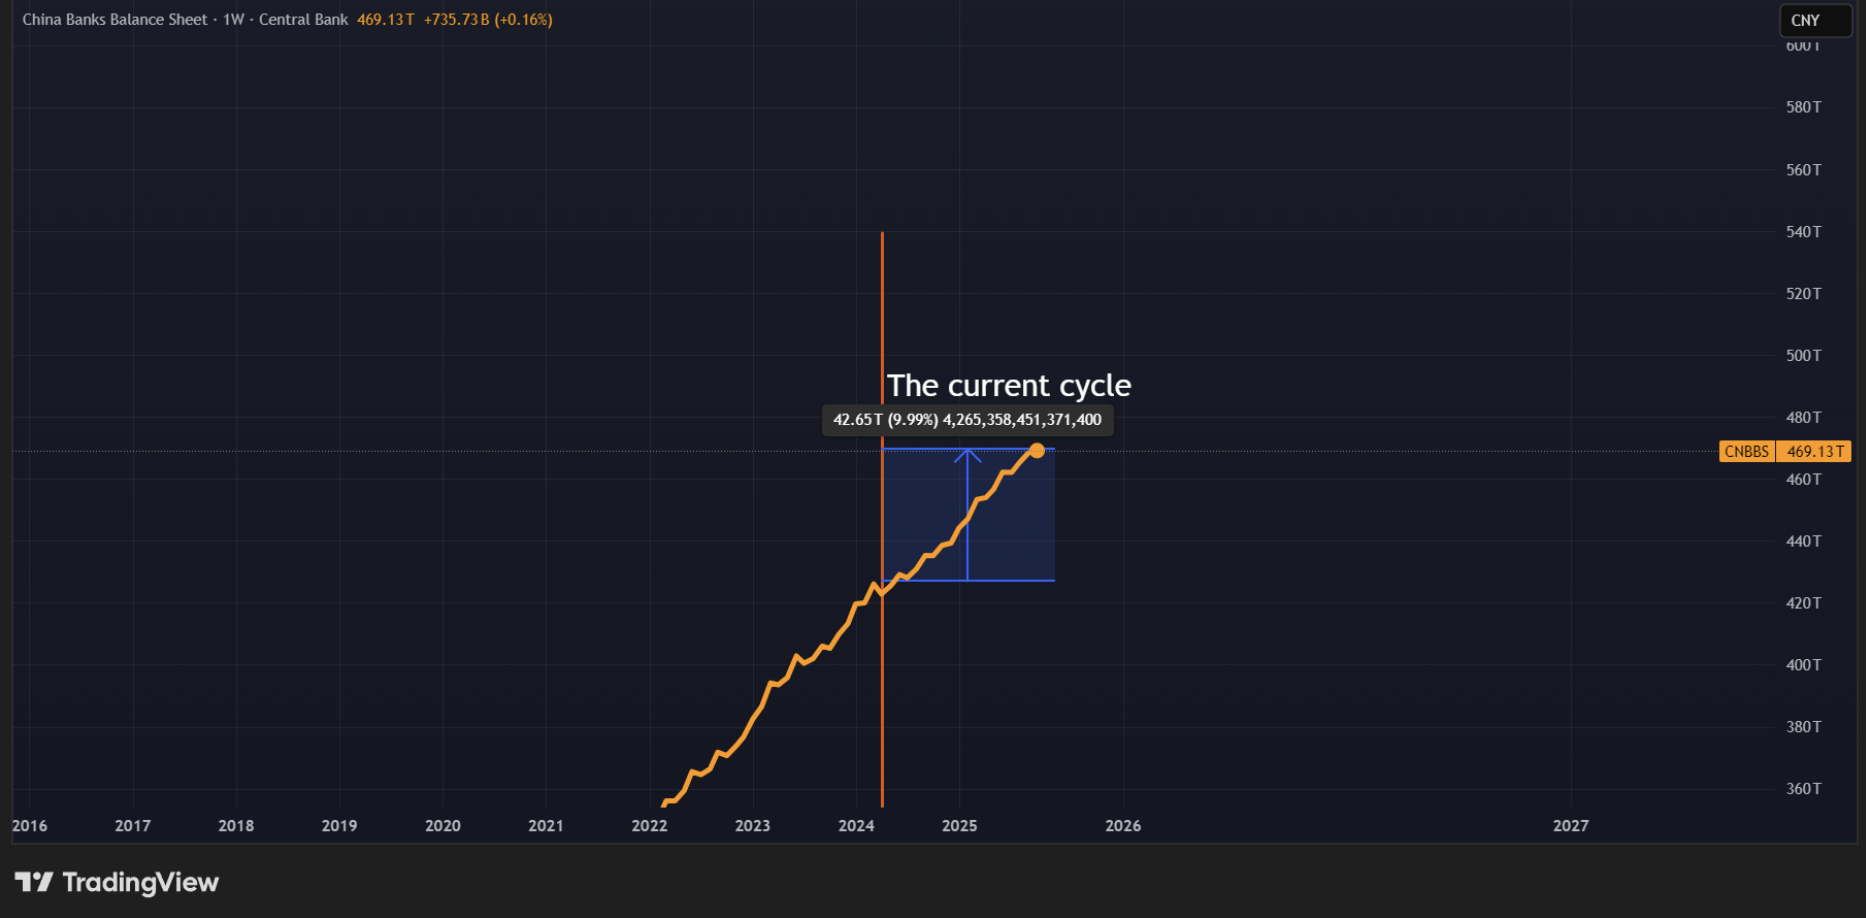
The only major central bank to have increased its balance sheet since the start of the cycle is the People's Bank of China, by around 10%.
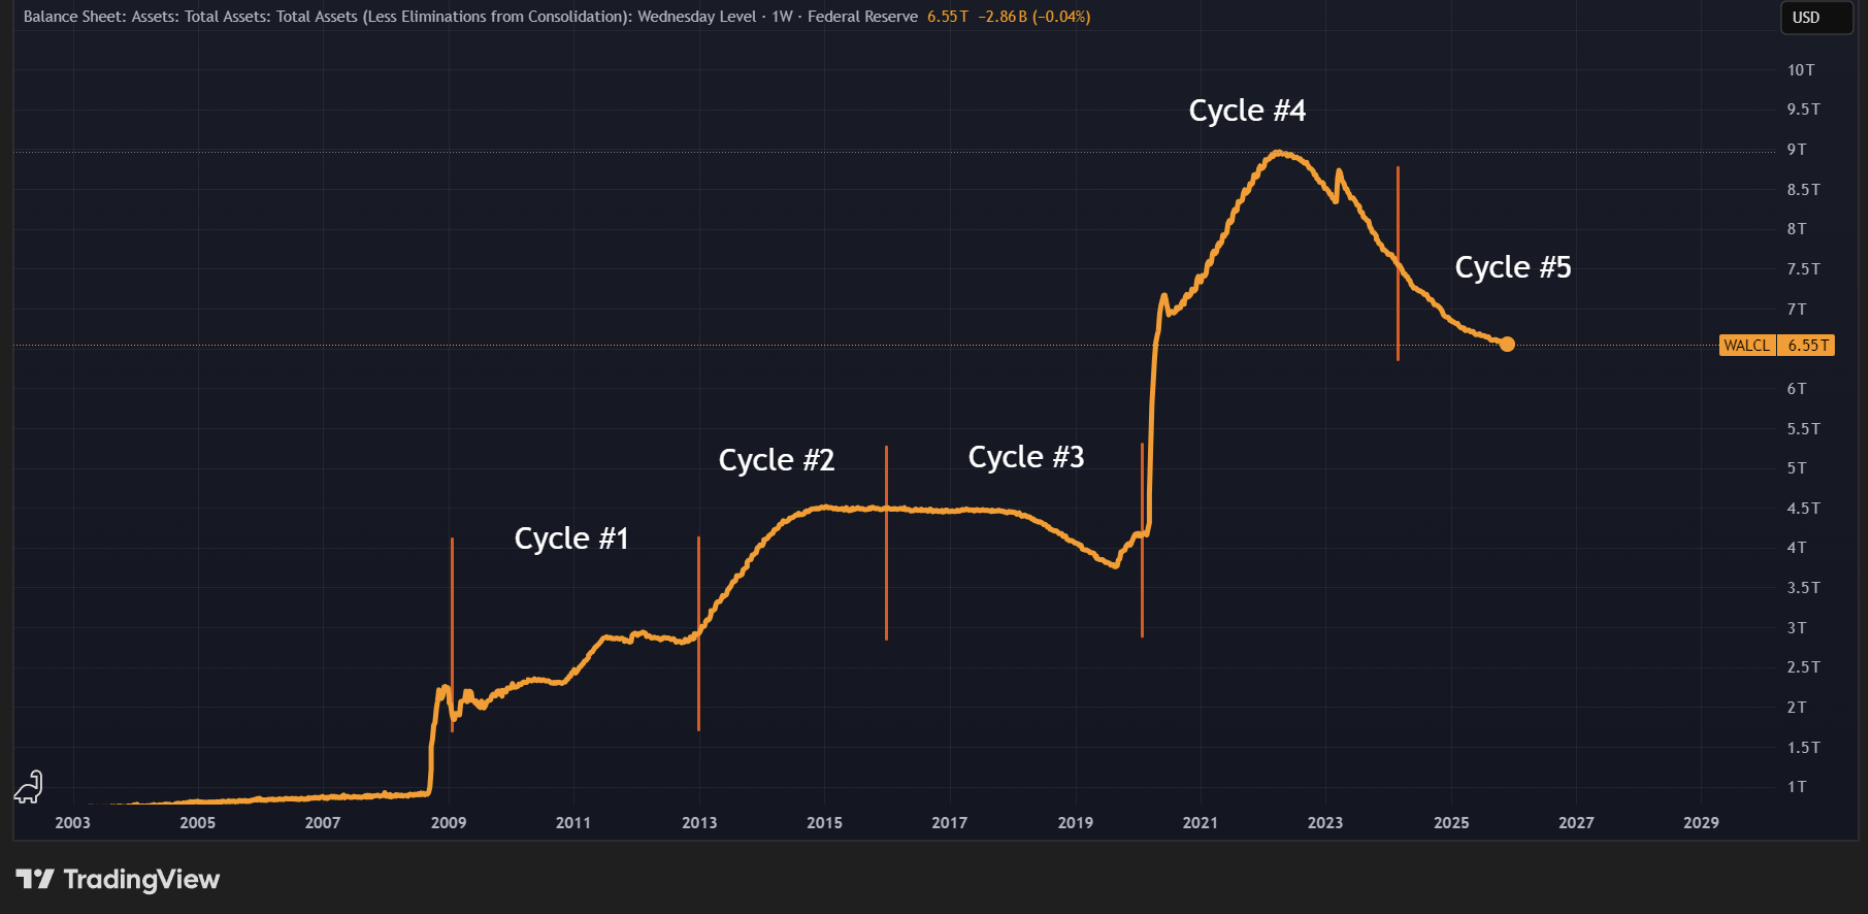


The only real similarity with the 2016-2020 cycle is that bitcoin did not start this cycle under QE. It had then made a recovery high in 2019, after the bear market of 2018, in a QT context, precisely at the time of the announcement of the end of that tightening. This 2019 peak was not, however, the peak of the 2016-2020 cycle, unlike the 2017 peak or the October 2025 peak for the current cycle.
Interest rates
The fifth halving cycle began in an environment of particularly high interest rates, above 4%. The aggressive hikes implemented to combat post-Covid inflation are weighing heavily on the economy.
In the first, second and fourth cycles, bitcoin had reached a euphoric peak in a near-zero rate environment, marked by abundant liquidity. The 2017 peak is the only other one reached in an environment of relatively high rates, but at levels well below today's (1.25-1.5% compared with 4-3.75% currently).
Sustainably high rates create difficult macroeconomic conditions: high financing costs, restricted credit and a slowdown in activity. Combined with the development of AI, these factors have led many companies to downsize, severely affecting household liquidity, which played a key role in previous cycles.

In September 2025, the Fed began a cycle of rate cuts. However, these cuts are more akin to an emergency measure designed to kick-start activity than support for an already growing economy.
In addition, the SOFR rate (an overnight rate backed by US Treasury securities at which financial institutions lend to each other) has moved above the effective federal funds rate, signalling liquidity pressures on the interbank market. In practical terms, this means that some institutions are struggling to borrow against their collateral because of the risks on their balance sheets, which is pulling the SOFR higher.
This situation has weighed on risky assets overall, with the notable exception of the S&P 500, whose trajectory has decoupled from nominal macroeconomic indicators.
No euphoric top
The absence of a euphoric phase and parabolic top suggests that economic growth is insufficient to generate abundant liquidity. The retail investor segment, traditionally a driving force in the final phases of the cycle, is virtually absent this time. The central question is therefore: why?
The main reasons lie in rising unemployment, the exhaustion of excess savings due to the cost of living and the economic slowdown, with the notable exception of the AI sector and some large technology companies.
In practice, households no longer have sufficient financial margins and are facing faster job destruction, while the economy is slowing, as indicated by the ISM PMI index.

The correlation between euphoric highs and a PMI above 55 is striking. The PMI is one of the main leading indicators of manufacturing activity and economic conditions. An index below 50 signals a slowdown. The fact that bitcoin peaked when the PMI was weak confirms the absence of a euphoric top; for such a top to form, the PMI would have to exceed 55.
This coincides with an upward trend in the unemployment rate, now around 4.6%, which is pushing the Fed to cut rates pre-emptively rather than in a context of solid growth.
An extremely concentrated market and the "ouroboros" of AI
A market dominated by stock selection means that only a few stocks have outperformed despite the overall liquidity squeeze.
According to JPMorgan, since the launch of ChatGPT in November 2022, AI-related companies and the "Magnificent Seven" have generated 75% of S&P 500 performance, 80% of earnings growth and 90% of capital expenditure.
The bank also estimates that US tech giants will invest an average of $500bn a year in AI, with global spending on data centres and AI infrastructure of between $3 trillion and $5 trillion.
.png)
These massive capital flows have sustained a sustained bullish sentiment on equity markets, concentrating the rise on a very limited number of stocks.
Although bitcoin is often presented as a store of value, its performance remains closely linked to global liquidity, i.e. the pool of capital available for investment. Like any risky asset, it benefits from an expansion in liquidity.
Since 2022, and even more so at the start of the current cycle, global liquidity has contracted, resulting in limited performance for bitcoin and almost nonexistent performance for altcoins.
In this context, the combination of the risk of a currency crisis and spiralling debt has favoured gold, which has outperformed most asset classes with a rise of around 55% since the start of the year, becoming a preferred choice for institutional and retail investors seeking protection against currency depreciation.
A lengthened cycle rather than a classic one?
With the introduction of ETFs and the massive entry of institutional players into the bitcoin and digital assets market, some believe that the cycle is now lengthened and that a phase of euphoria is still to come. The maturity of the asset is increasing (diminishing returns, more limited drawdowns, growing institutional share), which raises the question of the relevance of the halving cycle. The arguments put forward in favour of an extended cycle are as follows:
- The Fed is cutting rates and officially ending QT on 30 November, with a high probability of QE resumption.
- Unprecedented institutional participation (states, governments, corporates, bitcoin treasury vehicles).
- ETFs are a structural demand.
- Various categories of large holders are accumulating bitcoin.
- Many on-chain indicators (MVRV Z-score, profit share of supply, Mayer multiple) historically suggest that the bull market is not over.
- A supply shock is expected due to halving.
Despite these arguments, price trends tend to reproduce historical patterns, with an entry into the bear market in the intervening years, i.e. around two years after halving.
The Big Whale's view: where do we stand?
At this stage of the economic cycle, the trajectory of the bitcoin price remains difficult to anticipate. Many new factors have blurred the parallels with past cycles. Yet price behaviour remains comparable, peaking around a month earlier than in previous cycles.
On a macroeconomic level, the most relevant comparison remains with 2019, when the Fed was cutting rates and launching QE. The major difference is that bitcoin was then in the final year of the 2016-2020 cycle.
After the QE announcement in September 2019, it had taken around two months for bitcoin to bottom (excluding the Covid-19 shock), before a surge from October 2020, a year after the official start of QE.
Applying this logic, bitcoin could bottom one to three months after the Fed officially announces QE. After the formal end of the largest phase of monetary tightening in December 2025, a low could thus form between February and March 2026. A conservative scenario would place this bottom around the 200-week moving average, currently close to $57,000.
Conclusion: market signals suggest that the four-year cycle remains relevant and that the digital asset market has entered a bearish phase. Bitcoin's trajectory shows that institutional presence can accelerate certain dynamics, but its cyclicality and sensitivity to global liquidity remain intact. In this sense, this cycle may ultimately not be so different from previous ones.
>> Discover our dashboard dedicated to Bitcoin