TBW - State of Crypto Report - Q2 2025

After a first quarter marked by profit-taking and a tense macroeconomic environment, the second quarter of 2025 showed a clear recovery in the crypto markets. Bitcoin hit a new all-time high of almost $113,000, compared with a low of around $74,000 in April. That's an increase of more than 50% in just a few weeks. Over the same period, the total capitalisation of the crypto market has risen from $2,600 billion to $3,400 billion (+20%), despite a fall in average daily volumes ($126 billion, compared with $146 billion the previous quarter).
There are several factors behind this rebound: the suspension of tariffs decided by Donald Trump at the beginning of April, the absence of an interest rate rise by the US Federal Reserve, the increase in the global money supply, but also geopolitical events such as the rise in tensions between Iran and Israel.
Added to this were major political decisions in three US states (Texas, Arizona, New Hampshire) which voted to adopt bitcoin as a strategic reserve asset, as well as continued inflows into bitcoin ETFs and massive purchases by listed companies specialising in holding BTC. This backdrop has fuelled very favourable price momentum.
The State of Bitcoin
Bitcoin has benefited from a significant influx of institutional capital. Asset-backed ETFs recorded $12.77 billion in net inflows during the quarter, up from just $419 million in Q1. But it was listed Bitcoin Treasury Companies that were the most active, with more than 131,000 BTC purchased during the quarter, amounting to more than $13 billion based on an estimated average transaction price of $106,000.
>> Exclusive study - Institutional buys could push Bitcoin price to $180,000 by 2026
Structurally, on-chain data shows contrasting movements. Addresses holding between 1 and 100 bitcoins have sharply reduced their exposure (20,000 fewer addresses in total), while the smallest holders (less than 0.01 BTC) have increased slightly. Very large wallets (over 1,000 BTC), on the other hand, absorbed a large proportion of the supply sold. Over one year, these "whales" accumulated an additional 450,000 bitcoins. Conversely, so-called short-term investors sold more than 50,000 BTC.

As for economic metrics, the average cost of buying bitcoin for short-term investors is now estimated at $97,000, meaning they are back in the black after a complicated start to the year. Long-term investors, meanwhile, have an average acquisition cost of less than $60,000. On average, across all profiles, the average network purchase cost is valued at $48,900, reflecting a latent return of over 100% for the average holder.

On the infrastructure side, mining difficulty continued to rise, reaching 126 EH/s in June, compared with 113 EH/s at the start of the quarter. The hashrate, i.e. the computing power allocated to the network, corrected slightly at the end of the period to 116 EH/s. Despite this trend, miners remained profitable over the quarter as a whole, with margins ranging between 24% and 36%.

>> Bitcoin Mining: A Profitable but Only-for-the-Powerful Industry
While the overall trend remains positive, a recent decision by Bitcoin's development core is raising questions. The Bitcoin Core team plans to remove the 80-byte limit on data insertable via the OP_RETURN command in its next update (version 30), scheduled for October. This limit would be raised to 4 megabytes, which could open the door to an increase in non-essential (or even undesirable) content in network blocks. In response, the share of Bitcoin Knots nodes (an alternative version of the software) has risen sharply to 12% of the total, reflecting a degree of distrust of this development.
Best performing assets in Q2

On the performance front, ETH took the lead in Q2 2025 with a 58% rise. This was a complete turnaround after a difficult start to the year, when the asset lost more than half its value. The reasons for this recovery include renewed institutional interest, official recognition by the SEC that ETH is not a security, and the prospect of Ethereum ETFs incorporating staking revenues in the future. The ecosystem also continues to evolve on a technical level, with several updates planned over the coming months.
>> Ethereum: towards a real cycle turnaround?
BTC follows with a 38% return over the quarter, driven by massive inflows into ETFs and sustained buying by treasury firms. After hitting a record high of $113,000, the price stabilised at around $108,400.
Aside from these two leaders, the rest of the crypto market (excluding BTC, ETH and stablecoins) rose by 24%, but without regaining the momentum of previous cycles. The lack of a real monetary pivot from central banks continues to weigh on the performance of altcoins, which are highly sensitive to liquidity conditions.
As for the traditional markets, the US indices recorded a marked rise. The S&P 500 gained nearly 25%, while the Nasdaq jumped more than 34%, benefiting like the crypto market from the announcement of the Trump administration's 90-day pause on tariffs. These performances are well above the historical average for equity markets, which is around 10% a year, including dividends.
Gold, often used as a safe-haven asset, continued to rise but at a more moderate pace. After a 27% rise in the first quarter, second-quarter performance was limited to 7.75%, which is still above its long-term annual average.
One of the signals most closely watched by investors came from the US bond market. The yield on 10-year bonds rose by 9.7% over the quarter, reflecting a monetary policy that remains unchanged. The Federal Reserve has yet to initiate a rate cut, and market expectations are now for a status quo until the end of the year.
In this context, Moody's downgraded the US credit rating from Aaa to Aa1. This downgrade comes on top of a wider recomposition of US debt ownership: China continues to reduce its exposure as part of a de-dollarisation strategy, while Japan, which has become the US's largest creditor, has raised rates, which could revive carry trade strategies.
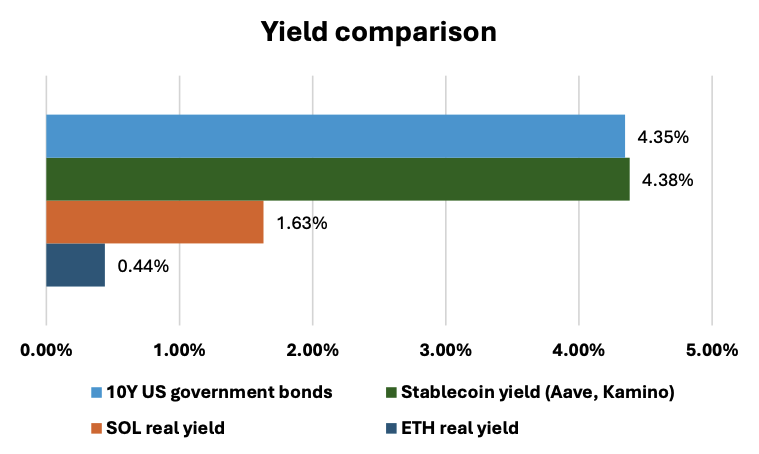
The yields offered by stablecoins have remained close to those of US government bonds. However, they offer greater flexibility, thanks in particular to their integration into DeFi vaults, which sometimes enable additional yield to be captured via native tokens. These products do, however, carry counterparty risks, unlike sovereign bonds.
On the blockchain side, net yields (staking minus dilution) on Ethereum and Solana remain lower than those on stablecoins or US bonds. But in return these assets offer the prospect of capital appreciation, which is not the case with stablecoin or T-Bill.
The state of Layer 1 blockchains
Weekly active users
The number of daily active users remains one of the most widely used indicators of blockchain activity. An increase in the number of users generally means more transactions, and therefore more fees collected, and better value capture by the chain.
On this front, Solana remained in the lead in the second quarter, peaking at almost 30 million weekly active users in June, before falling back to 17 million. For its part, BNB Chain (ex-Binance Smart Chain) recorded the strongest continuous growth over the quarter, with average weekly growth of 3.87%. It returned to Solana's level in the final days of June. Conversely, Sui saw its number of users fall steadily (-5.4% on average), particularly after a hack affected its liquidity.

Weekly active developers
The number of active developers on a blockchain is often a leading indicator of the health of an ecosystem. It reflects the vitality of ongoing projects, the capacity for innovation and, ultimately, user adoption.
In the second quarter, all Layer 1 blockchains saw a decline in the number of active developers. In total, the top ten blockchains by capitalisation were down to just 600 weekly active developers at the end of June. Solana suffered the biggest drop, falling from 54 to 29 active developers in the space of a few weeks, an average contraction of 4.67%. Ethereum remains the platform most followed by developers, with around 200 active contributors per week. Also worth noting is the rise of Hyperliquid, which went from 10 to 13 weekly active developers over the period.

Number of weekly transactions
Transaction volume remains a direct indicator of a blockchain's economic activity and its ability to generate revenue.
On this front, Solana has seen its dominance challenged by Hyperliquid. The latter recorded a total volume of 42.67 billion transactions in the second quarter, compared with Solana's 32.1 billion. Cardano remains the least-used blockchain with just 2.78 million transactions over the same period.

Weekly inflation
Inflation measures the growth in the supply of a token in circulation. A high level of inflation, if not offset by equivalent or greater demand, can weigh on prices by generating constant selling pressure.
Sui made two significant token releases during the quarter, representing around 3% of supply in April and June. Cardano released 5.6% of its supply in May. Aptos (0.49%) and Sui (0.47%) recorded the highest average weekly inflations. By contrast, Ethereum (ETH) and Binance Coin (BNB) recorded no inflation over the period. Solana unlocked an average of 0.31% of its supply each week. Notably, Tron was slightly deflationary, with an average supply decline of 0.02% over the quarter.

Layer 1 TVL
The total locked value (TVL) in Layer 1 blockchains rose 38.5% in Q2, from $83bn to $115bn. Ethereum remains by far the leading blockchain in terms of TVL, with an increase of $22 billion over the period, representing average growth of 3.05% per week. The chain now accounts for 56.5% of total L1 TVL.
All the major blockchains saw their TVL increase in the second quarter, but the most marked change remains Hyperliquid, which grew from $350 million to $1.77 billion in three months.

Fees
Fees are a direct indicator of the value captured by a blockchain. The higher the fees, the more profitable the blockchain. A rise in fees also reflects increased usage, which can reinforce the value of the associated token.
As in the first quarter, Tron remained in the lead on this criterion, with nearly $985 million in fees collected in the second quarter. The gap is very wide with the runner-up, Solana, which collected around $120 million. Hyperliquid was the fastest-growing, with an average increase of 14.25% over the period. At the other end of the scale, Aptos generated just $206,000 in fees.

>> Tron: A stablecoin infrastructure under tension
GDP of blockchains
Layer 1 blockchains function like real digital economies: they have costs, revenues, business activities, participants and financial flows. It is therefore possible to measure their GDP (gross domestic product), i.e. the economic value created.
Ethereum remains the blockchain that generated the most value during the quarter, with an average GDP of $130 million per week. Solana comes in second with an average GDP of 64 million, half as much. On average, most L1s saw their GDP fall in Q2: -2.2% for Ethereum, -1.3% for Solana, -2% for Aptos and -15% for Avalanche. Only Binance Smart Chain (BSC) posted economic growth, with an average increase of 5.7%.

Fully Diluted Capitalisation per Active User (FDMC/WAU)
This ratio is used to assess the value attributed to each weekly active user, using Fully Diluted Market Cap (FDMC) as a benchmark. The lower this ratio, the more undervalued the asset is considered to be in relation to its use.
Aptos emerges as the most undervalued blockchain according to this criterion, with an FDMC per active user of $1,497. Hyperliquid and Solana follow with $2,864 and $4,834 per user respectively. Conversely, Cardano remains the most overvalued chain with a CME per active user of over $1.19 million.

Capitalization per transaction (FDMC/Trx)
In the same logic, this ratio evaluates how many dollars of diluted capitalization are associated with each annual transaction. A lower ratio indicates better effective use of the blockchain relative to its valuation.
Here again, Cardano stands out as the most overvalued blockchain, with an average of $2,422 of diluted capitalisation per transaction. Hyperliquid ($0.16) and Solana ($0.59) emerge as the most efficient blockchains in terms of value per transaction.

Price-to-earnings (P/E) ratio
The P/E (price-to-earnings) ratio measures how much investors pay for each dollar of income generated through fees. It is a classic indicator in traditional finance, applied here to blockchains.
The average P/E for L1s in the second quarter was 1,496, down slightly from 1,565 in the previous quarter. This may indicate some form of return to more rational valuations. Below this average are blockchains that are considered undervalued. Tron tops the list with a P/E of just 6.33. Solana follows with a ratio of 142. Ethereum, BSC, Hyperliquid, Sui and Toncoin are also below average.
The most overvalued blockchains by this criterion are Avalanche, Aptos and especially Cardano, which has a very high ratio of 6,636.

Capital flows
Ethereum saw a marked return of capital in the second quarter, following three weeks of outflows at the start of the period. Net inflows reached $2.6 billion, driven by renewed interest in ETH ETFs. Sui also had an active quarter, with $46 million in inflows. The figures were more modest for Solana (2.47 million) and Cardano (3.64 million), but the latter outperformed Solana over the period, in contrast to the trends seen in Q1.
Solana in fact saw its inflows fall sharply, from 77 million in Q1 to less than 3 million in Q2, a sign of a temporary waning of investor interest.

Stablecoin status
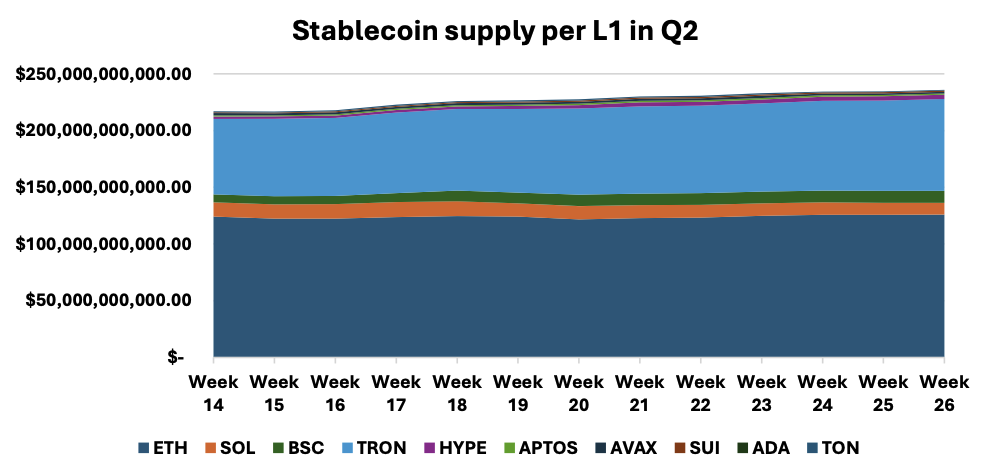
The supply of stablecoins on a blockchain is a good indicator of available liquidity and demand for on-chain crypto products, such as yield mechanisms or decentralised exchanges.
Ethereum and Tron continue to dominate on this front, with the largest amounts of stablecoins in circulation. Tron is cementing its position as the preferred channel for Tether USDT, with a 21.6% increase in supply in the second quarter. Conversely, Solana and Avalanche saw their stablecoin supply decline, a generally negative signal for economic activity on these channels. Hyperliquid posted the biggest increase, with an 86.5% rise in stablecoin supply.
> Stablecoins : US adopts GENIUS Act, what you need to know
Comparative L1 performance
Hyperliquid stood out in Q2 with a return of +287%, the best performance among the top ten blockchains. Ethereum also had a strong quarter, followed by Sui and Solana. At the other end of the spectrum, TON recorded the worst performance with a drop of 2.2%.

The big winner of the quarter: Hyperliquid
A new player has made its grand entrance among the leading Layer 1 blockchains: Hyperliquid. The chain has taken Near's place in the top ten, with sustained growth on several indicators: the best price performance (+287%), the highest number of transactions in the second quarter (ahead of Solana), and a growing presence in discussions around blockchain valuation.
Tron remains the undisputed leader on the issue of fees. Ethereum, meanwhile, retains the top spot in terms of the number of active developers and total locked value (TVL). Solana continues to lead in terms of the number of users, although Binance Smart Chain is rapidly gaining ground. Ethereum also stood out with strong inflows, to the tune of $2.6 billion, which supported its performance (+58% over the quarter).
The Big Whale's opinion
The second quarter marked a return to the upside for crypto assets, after a difficult first quarter amid macroeconomic tensions and political uncertainty. The announcement of the Trump administration's temporary (90-day) suspension of tariffs at the beginning of April was a clear trigger for the markets, bringing renewed confidence and redirecting capital towards assets deemed riskier.
ETFs played a central role in this recovery, with almost $13 billion injected into bitcoin and $2.6 billion into Ethereum. Against a backdrop where the US Federal Reserve remains undecided on rates, investors seem to be anticipating a future cut, or at least moving away from them in the short term.
Economic conditions aside, the quarter was marked by a sharp acceleration in institutional adoption. Some Layer 1 blockchains, beyond Bitcoin alone, have done well by attracting capital and developers, and expanding on-chain uses.
As the third quarter opens in a generally quieter climate (summer period obliges), the markets could be going through a consolidation phase. The expected resumption of tariffs in August and a potentially less accommodative Fed could create tensions. All eyes are now on the fourth quarter, which many are anticipating as a new catalyst. It remains to be seen whether these expectations will be confirmed.