TBW - Crypto Market Update: Top Performers of 2025

Introduction
The first quarter of 2025 was marked by tremors of rare intensity on the crypto-asset markets. Buoyed by post-election euphoria in the United States and Donald Trump's rise to power - perceived as favourable to the industry - the crypto ecosystem had started the year with its foot to the floor. But the landing was brutal. In February, prices plummeted, before a veritable "Black Monday" in early April.
On 1 January, the total market capitalisation (CMC) reached $3,260 billion, with a daily volume of 115 billion dolalrs. Three months later, the landscape had changed radically: capitalisation had fallen to $2,640 billion (-19%), with daily volume down to $75.26 billion.
This tumble is rooted in the return of macroeconomic uncertainties: the risk of a resurgence in inflation, renewed trade tensions between the United States and China, fears of recession, etc. All fuelled by the Trump administration's protectionist policy, which has unleashed a new salvo of tariffs. The result: risky assets fell back in February, after Bitcoin signed a new ATH in January.
In this report, we take a detailed look at the fundamental indicators for the 10 main smart contract blockchains (the "layer 1s"), through data on active users, developers, TVL, fees, inflation, price/earnings ratios, ETFs and capital flows. We'll also look at Bitcoin's on-chain activity and ETF inflows/outflows.
Overview
The quarter had got off to a flying start for the crypto market. Donald Trump's inauguration in January rekindled interest among both retail and institutional investors. In its wake, memecoin fever exploded, driven by the Pump.fun platform, triggering an unprecedented boom.
The result: the market's total capitalisation reached a quarterly peak of $3,650 billion. In the wake of this, trading volumes soared. On 20 and 21 January, daily volumes exceeded $300 billion on two consecutive days - the highest since the bull run of 2021.

Trading volume peaked in January, with a second peak in early February: on that day, the crypto market recorded a quarterly record of $362.15 billion in daily volume. But what followed was far less stellar. From mid-February onwards, volumes contracted significantly, continuing to fall throughout March - a decline that was accompanied by a marked fall in total market capitalisation.

The cause: large net outflows from the Bitcoin and Ethereum ETFs, week after week in February. These withdrawals were motivated by massive profit-taking, following the peaks reached in December and January. This was compounded by monetary disappointment: at its meeting on 29 January, the Fed decided to take a break from cutting key rates, cooling investor ardour.
Another aggravating factor: quantitative tightening (QT), which has been ongoing since March 2023, with a 1.09% reduction in the Federal Reserve's balance sheet, has heightened risk aversion on the markets. In March, trade tensions returned to the fore, with the threat of new tariffs, which continued to weigh on overall market capitalisation.
To make matters worse, the Fed kept its key rate unchanged at the FOMC meeting on 18 March, while J.P. Morgan raised the probability of a recession in 2025... to 60%.
Despite the storm that shook the entire market, Bitcoin remained solid and even strengthened its dominance. Its share of total capitalisation rose from 57% to over 62% at the end of the first quarter. This resilience is explained by its perceived status as a safe haven in the face of inflation, a role that investors continue to ascribe to it.

Since 24 February, the Altseason Index has been stuck between 13 and 20 (out of 100), a clear signal that Bitcoin has significantly outperformed the rest of the market. While altcoins underwent a severe correction, the trend towards BTC accumulation by treasuries - both public and private - helped to maintain Bitcoin's price and further increase its dominance.
The State of Bitcoin
The start of the year was thunderous for Bitcoin, which reached a new ATH of $109,000 in January. The correction was swift: the price fell back into the $90,000 area, hit a low of $74,000, before stabilising at around $85,000 to $86,000.
This surge was accompanied by massive inflows into Bitcoin ETFs, the largest since November 2024. On several days - 3, 6 and 17 January - inflows exceeded $900 million. At the end of January, assets under management (AUM) in BTC ETFs reached $124.54 billion, with IBIT (BlackRock) leading the pack.
But February marked a turning point. It was a month of record outflows: on 24, 25 and 26 February, $516.4 million, $1.01 billion and $754.6 million respectively flew out the door. In one month, ETFs lost $24 billion in AUM, a fall of 19%.
In March, flows slowed markedly compared with the previous two months. At the end of March, Bitcoin ETFs had $97.96 billion in assets under management. IBIT still dominates the sector, with 572,230 BTC under management - almost half of all AUM. This is followed by FBTC (Fidelity) with 196,810 BTC, GBTC (Grayscale) with 190,130 BTC, and then ARKB (Ark Invest), which closes the gap with 47,390 BTC.

BTC balances on exchange platforms remained broadly stable in the first quarter. In January, the number of bitcoins available fell from 2.22 million to 2.15 million, with a wave of withdrawals of around 70,000 BTC stopping on 5 February. Then, the movement reversed: investors began to redeposit BTC on the platforms in February and March, temporarily boosting the available supply to 2.24 million BTC, before it fell back to 2.18 million on 31 March.
On the whale side - those addresses holding between 1,000 and 10,000 BTC - activity was particularly marked. In January and early February, these players accumulated massively, with a year-on-year increase of 390,000 BTC. But the dynamic changed abruptly at the beginning of February, with a sale of around 150,000 BTC, reducing their net balance to +243,000 BTC over one year.
The selling pressure continued at the end of the month, with a further 50,000 BTC liquidated. The annual balance for this group then hit a low of +193,000 BTC. In March, these large pockets resumed their purchases, bringing their position down to around +300,000 BTC over a year.
It was these whale moves that amplified the selling pressure on the market in February, driving the price of Bitcoin down to as low as $78,000 at one point.

Despite the volatility of the quarter, the realised price of Bitcoin remained well below the market price - a clear sign that momentum remains bullish. As a reminder, the realised price is the average price at which BTC currently in circulation were last moved. It is one of the most closely watched on-chain indicators for distinguishing market phases: when the market price is below the realised price, Bitcoin is considered undervalued and the majority of holders are making a latent loss. Conversely, a market above the realised price suggests that the average investor is in gains - a possible signal of overheating.
In the first quarter, the realised price climbed to $43,900 per BTC, while the market price stayed between 1.7x and 2.48x that threshold. Conclusion: we are far from bear territory.

The fall in the price of Bitcoin in February and March mechanically reduced the proportion of supply in profit. At the beginning of January, almost 99% of BTC in circulation were showing a latent gain. This figure fell to 76.9% at the end of February, before bottoming out at 75.6% in March. At 31 March, 76% of supply was still in profit.
At the same time, the Bitcoin network's hashrate exploded to record levels, flirting with 1,000 exahashes per second, or 1 zetahash/second. The network evolved between 671 and 988 EH/s throughout the quarter, reflecting a significant increase in the difficulty of mining and the overall security of the protocol.
On the development side, the first quarter of 2025 was busy. The Bitcoin Core team focused its efforts on performance, P2P optimisation and expanded Miniscript support, in preparation for version 27.0. The debate surrounding the activation of the OP_CAT opcode, which could extend Bitcoin's smart contract capabilities, has picked up steam again - even though no activation on the mainnet has yet taken place. BIP324, which provides for encrypted P2P connections, has continued its tests on testnet.
The Lightning network continues to improve: better channel management, gains in confidentiality and splicing support. The development of Taproot Assets is also continuing. On the wallet side, Sparrow and Electrum have released major updates, integrating Taproot, PSBTs and new privacy tools.
Finally, several initiatives around decentralisation and privacy protection have advanced, such as CoinSwap, Silent Payments, and experiments around Drivechain, tested via hackathons and on testnet.
The state of L1 blockchains
In this section, we zoom in on the fundamental metrics of the 10 main smart contract (or Layer 1) blockchains. The aim: to understand their dynamics through a number of key indicators - active users, active developers, number of transactions, token inflation, fully diluted valuation relative to the number of users or transaction volume, fees generated, "on-chain GDP", price/earnings ratio, and TVL.
Weekly active users
One of the most scrutinised indicators: the number of active users. In this report, we focus on weekly rather than daily users, to better capture the real trend in each ecosystem. An increase in the number of weekly users reflects renewed interest in a channel, but also a rise in its economic activity, through a more sustained volume of transactions, higher fees, and therefore increased potential valuation.

Solana largely dominated the Layer 1 landscape in terms of weekly active users in the first quarter of 2025. Despite a significant drop in weeks 6 and 7, the blockchain started the quarter with more than 25 million weekly users. The peak was reached in week 3 (January), with almost 30 million users - an increase of around 20% over the period. But the end of the quarter was more complicated: Solana ended March with 18.3 million weekly users, down 27% on the high point.
In second place was BNB Chain, which established itself as the best-performing EVM-compatible channel. Its number of weekly users has fallen from 15 million to 10 million, a decline of 33%.
On the upside, TRON, Aptos and Sui stand out. Compared with the first week of January, TRON is up 8.7%, Aptos +16.7%, and Sui +151%. Sui was the quarter's big winner in this respect. Conversely, Avalanche recorded the biggest fall, with a 51.4% drop in weekly users.
>> Read our fundamental analysis of Aptos
>> Read our fundamental analysis of Sui
Weekly Active Developers
Follow the developers, follow the money. This well-known mantra in the ecosystem sums up what's at stake: the more developers a channel attracts, the more likely it is to see uses emerge, capture value, and build user loyalty. Here are the levels of developer activity on the main L1s in the first quarter of 2025:

Unsurprisingly, Ethereum retains its number one position in terms of active developers. Better still, the channel posted an 18.8% increase in the number of active developers over the quarter - proof that interest in developing on Ethereum is still very strong.
>> Ethereum: what's the big deal?
But it's TON (The Open Network) that is causing a surprise. With a 75% increase in the number of active developers between week 1 and week 13, TON recorded the biggest relative increase of all L1 blockchains. In second place: Aptos, with equally robust growth of 47.9%. For the other blockchains, the picture is much more mixed, with curves either flat or trending slightly downwards.
>> Our fundamental analysis of TON
Weekly number of transactions
This metric speaks for itself: it directly reflects a blockchain's ability to create value and generate revenue.

Solana literally crushed the competition in the first quarter in terms of the number of transactions. Buoyed by the memecoin craze and the explosion in the use of DEX, the blockchain was used more than all the other L1s put together. Its weekly volume rose from 1.6 billion transactions in week 1 to 2.6 billion in week 13, an increase of 62.5%.
>> Solana (SOL): Analysis of a project that is making a very strong comeback
Other blockchains also saw their activity climb, despite the decline in prices in the second half of the quarter. TRON and NEAR doubled their number of transactions over the period. Cardano, on the other hand, was the exception: its activity fell from 371,000 to 200,000 weekly transactions, a drop of 46% over the quarter.
Weekly inflation
Inflation remains an essential indicator for assessing the dilution of tokens in circulation. Poorly controlled, it exerts constant selling pressure and limits the potential for price rises. Calculated as the weekly change in supply in circulation, it gives a good idea of the monetary discipline of a blockchain.
Over the quarter as a whole, most of the major L1 platforms kept their inflation below 1%, with the exception of weeks 5, 7 and 9, which were marked by one-off spikes.
Tron holds the absolute record: in a single week, TRX supply jumped by almost 9%. Solana, meanwhile, saw tokens unlocked by 2.37% in week 7. Sui suffered two inflationary spikes: 3.33% in week 5 and 3.23% in week 9. The rest of the pack remained generally benign, although Aptos broke through the symbolic 1% weekly inflation threshold on several occasions.

TVL
Ethereum retains its supremacy in TVL (Total Value Locked), a key indicator that reflects the confidence of investors and traders. Ethereum's DeFi protocols continue to capture the largest share of capital injected into decentralised finance.
But the first quarter was brutal: TVL fell by 33% on both Ethereum and Solana. On the scale of the entire DeFi sector, the drop reached 28%. A massive reflux, in line with the macro context and the devaluation of many tokens.

Fees
Fees are a direct measure of the value captured by a blockchain. The higher they are, the more profitable the network. A rise in fees also signals increased usage, boosting the value of the blockchain and its native token.
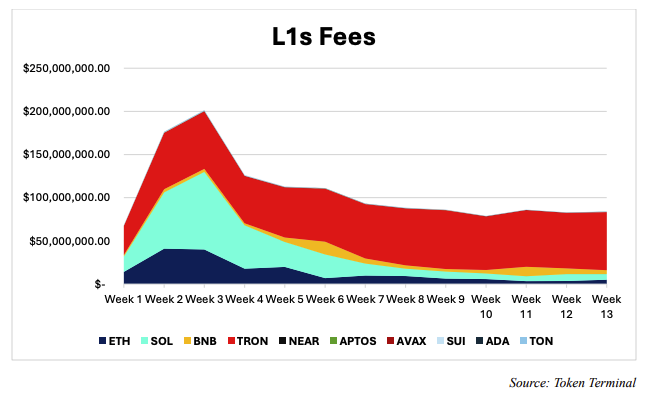
In the first week of January, TRON, Solana and Ethereum accounted for 95.76% of the fees generated by the top 10 L1 blockchains. TRON alone raked in $33 billion, more than Ethereum and Solana combined.
But everything changed in weeks 2 and 3 of January. Buoyed by the Pump.fun frenzy, Solana exploded the counters with $65 billion in fees in the second week, then almost $89.9 billion the following week - a performance all the more impressive given that each transaction on Solana costs an average of just $0.00025.
At the same time, fees on Ethereum and TRON also rose: $41 billion then $40 billion for Ethereum, $65 then $66 billion for TRON. But the rest of the quarter turned the tables. While fees on Ethereum and Solana collapsed, TRON held steady, averaging $60 billion in fees per week, establishing itself as the most profitable L1 blockchain of the quarter.
GDP on-chain
Layer 1 blockchains function as true digital economies: they have costs, value flows, businesses built on them, investors, participants, imports and exports. Based on this observation, we can measure an "on-chain GDP" to estimate the real monetary size of each L1 - and thus compare their economic vitality.

Solana saw a spectacular jump in its on-chain GDP at the start of the quarter. Between the first and third weeks of January, its economic activity rose from $23 million to $108 million, an increase of 364% - boosted by the explosion of memecoins and DeFi activity on the blockchain.
>> Solana and memecoins: investigating a toxic addiction
At the same time, Ethereum saw its on-chain GDP rise by 133%, BNB doubled, while Aptos and Avalanche recorded growth of between 260% and 270%.
But for Solana, the aftermath was far less flamboyant. Its weekly GDP fell to just $8 million at the very end of the quarter. Ethereum, meanwhile, remained the largest digital economy among the L1s, with stable output of more than $55 million in weekly GDP.
FDMC/WAU
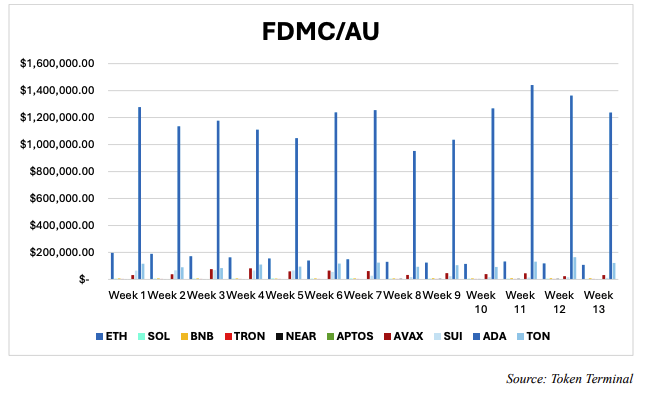
The FDMC / WAU ratio (Fully Diluted Market Cap divided by the number of weekly active users) is used to assess the value that the market places on each active user of a blockchain. The lower this ratio, the more the blockchain is perceived as undervalued in relation to its actual use - and therefore likely to represent an opportunity against its competitors.
At the end of the first quarter, Aptos emerged as the "cheapest" L1 according to this criterion, with a valuation of $1,168 per weekly active user, down sharply from the $2,400 recorded at the start of the period.
Behind it are NEAR ($2,800), Solana ($3,900) and TRON ($3,600), all below the sector average and therefore potentially undervalued.
At the other end of the spectrum, Cardano emerges as the most overvalued blockchain of the quarter, with a staggering FDMC / WAU ratio of $1.237 million per weekly active user.
FDMC/WAD (Fully Dilluted Market Cap dived with Weekly Active Developers)

Along the lines of the FDMC / active users ratio, the FDMC / number of transactions ratio measures the average value of fully diluted capitalisation that "circulates" per transaction. The lower this ratio, the more the channel is used - and the more the valuation appears aligned with actual activity on the network.
Over the first quarter of 2025, Solana emerged as the big winner, with an average of $27.44 of fully diluted capitalisation per transaction, down sharply from $69 at the start of the quarter. This level reflects intense and sustained use of the network.
In second place was NEAR, with a ratio of 67.72 dollars per transaction, confirming the chain's good business momentum.
In contrast, Cardano once again found itself at the bottom of the pack. Its high ratio and low transaction volume reflect minimal use, despite a still high valuation - a sign of a persistent misalignment between market price and actual use.
Price-to-earnings (P/E)

The price-to-earnings ratio (P/E) is a leading indicator in traditional financial markets and can also be applied to blockchains. The idea is to measure a blockchain's profitability by comparing the costs it generates with its total valuation, in order to assess the extent to which it is over- or undervalued compared with its peers.
On the graph, the black line represents the average P/E each week during the first quarter. Blockchains below this line are considered undervalued, those above it overvalued.
Only three L1s remained consistently above average: Aptos, Avalanche and above all Cardano, which stands out as the big loser in this ranking. Its average P/E ratio is a staggering 6,901, reflecting a glaring lack of profitability relative to its valuation.
In contrast, TRON is crushing the competition, with an average P/E ratio of 6.78. This means that, quarter after quarter, it is the most undervalued blockchain based on its ability to generate revenue.
Capital flow

Inflow on the main L1 blockchains over the quarter was mixed from week to week, but the overall picture is positive. Ethereum was once again the big winner, with $311 million in inflows and an all-time high of $793 million in a single week in week five. Solana followed solidly behind, attracting $77.11 million over the quarter. Sui also finished in the green with $27.4m, as did Cardano with $4.4m.
Who's the winner?
The L1 head-to-head in Q1 2025 revealed a polarised market, with several blockchains each dominating in very distinct areas.
Ethereum came out on top on fundamental metrics, with the highest number of weekly active developers, the strongest ability to attract capital, and the largest TVL in DeFi protocols.
Solana, meanwhile, outperformed the competition on activity, dominating by a wide margin on the number of transactions, weekly users and a FDMC/transaction ratio well below the industry average.
Tron put in a remarkable performance on fee generation, ending the quarter at the top of this ranking.
Finally, Aptos impressed with its on-chain GDP growth, confirming its upward momentum.
The Big Whale's view
The first quarter of 2025 was marked by an unprecedented wave of enthusiasm for crypto-assets, which peaked on the day of the US presidential inauguration, before continuing in the following weeks. Outstandings in Bitcoin ETFs reached an all-time high, while activity on the main L1 blockchains intensified. Solana dominated in terms of usage, thanks in particular to the memecoin craze, which caused fees to skyrocket. Ethereum, meanwhile, recorded the highest ever inflows in a single week, with $793 million. The rest of the altcoin market followed suit, buoyed by this collective momentum.
But by February, the momentum had turned. Continued monetary tightening, the pause in rate cuts announced by the Fed, and massive profit-taking triggered a sharp correction. The sector saw the biggest outflows in its history from Bitcoin and Ethereum ETFs. In March, fears about tariffs and the recession added to the downward pressure, causing the market's total capitalisation to plunge to $2,370 billion.
Is the bull market over? It's hard to say. But one thing is certain: markets hate uncertainty. Trade tensions, the risk of recession and the prospect of ever tighter monetary policy are holding back investors, who are reluctant to reposition themselves in risky assets such as altcoins.
As long as these fears persist and monetary policy does not change course, altcoins will continue to underperform. Bitcoin, without fully embodying the safe haven narrative, retains its status as a rare asset, a monetary alternative, and a hedge against long-term economic and geopolitical uncertainties.